Gaming's Life-Cycle Carbon Footprint
A gaming device has an emissions footprint before a player switches it on. Mining and processing materials, fabricating chips, assembling components, packaging and shipping equipment all contribute. Use adds electricity demand across the console or PC, display, network and supporting services. Repairs, replacements and end-of-life treatment complete the picture. A single carbon figure is meaningful only when its boundary and assumptions are visible.
The New Zealand setting changes the operational part of the calculation, not the entire life cycle. Local electricity is predominantly renewable on an annual basis, but electronics are manufactured through international supply chains and the electricity used in production comes from many places. A lower-carbon place of use cannot erase emissions embedded in materials, factories or freight.
Draw the boundary before calculating
A household assessment may count one console over its expected life. A manufacturer may report emissions across products sold in a financial year. A game publisher may include office energy, cloud services, marketing and player use. Those boundaries answer different questions. Comparing totals without matching the unit, product generation, time period and included activities creates false precision.
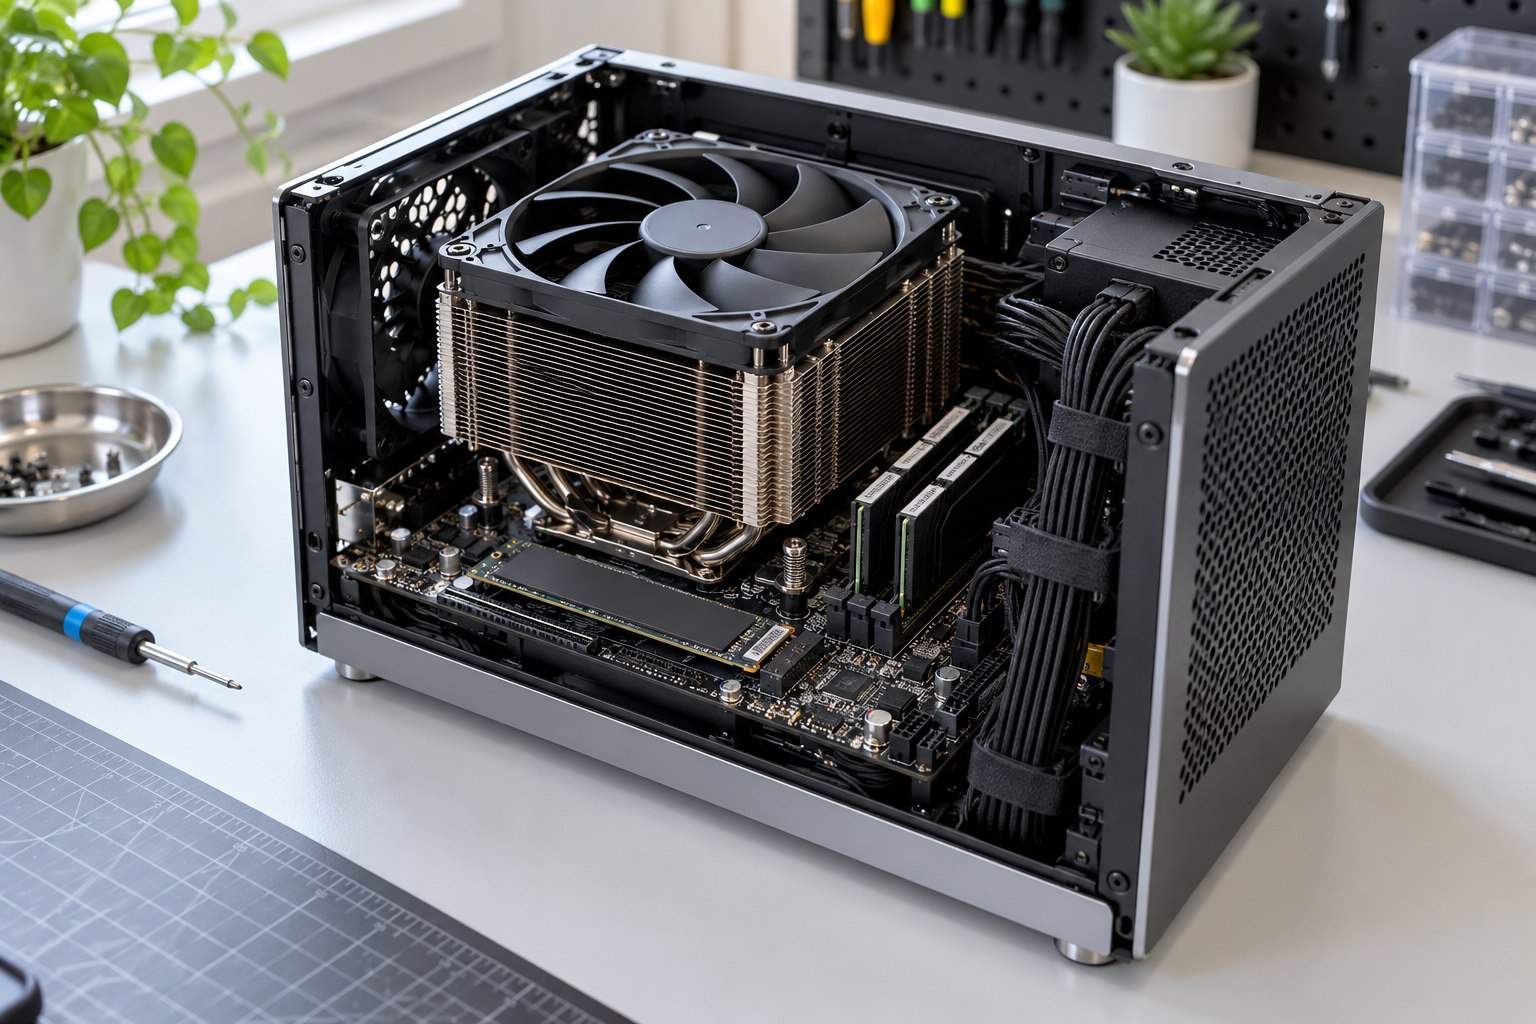
For a console, a useful boundary follows the product from raw materials through component production, assembly, distribution, use and end-of-life handling. A PC estimate needs a component list and replacement schedule because a graphics card, monitor and storage may be upgraded at different times. A game-service estimate adds data transfer, hosting and development tools, with allocation rules to avoid assigning shared server emissions entirely to one title.
The functional unit should match the comparison. “Per device sold” can compare product portfolios; “per gaming hour” can compare use patterns; “per player-year” can help assess a household routine. Each unit has blind spots. A per-hour result may favour a short-lived product that is replaced often, while a per-device figure ignores how long it stays in use.
Separate direct operations from value-chain emissions
Corporate accounts distinguish direct emissions, purchased electricity and other value-chain sources. That boundary matters in gaming: a studio pays for its office power, players power their own devices, and manufacturers account for production and product use. These categories organise responsibility but do not, by themselves, identify the best reduction measure.
Manufacturing and lifetime use can dominate different products depending on chip and display production, factory electricity, region, performance and years in service. Digital delivery still needs networks, storage and a client device; physical copies add production, packaging and freight but may be shared or resold. Compare the same service and state the assumptions about reuse, streaming and product life.
Manufacturing emissions sit upstream
Electronics depend on refined metals, plastics, glass, semiconductors and batteries. Chip fabrication involves tightly controlled processes, specialist chemicals, water and high-purity materials. Assembly plants add electricity and process emissions; freight moves components between suppliers, factories, warehouses and markets. Public product footprints may use supplier averages or engineering models rather than factory-by-factory meter data.
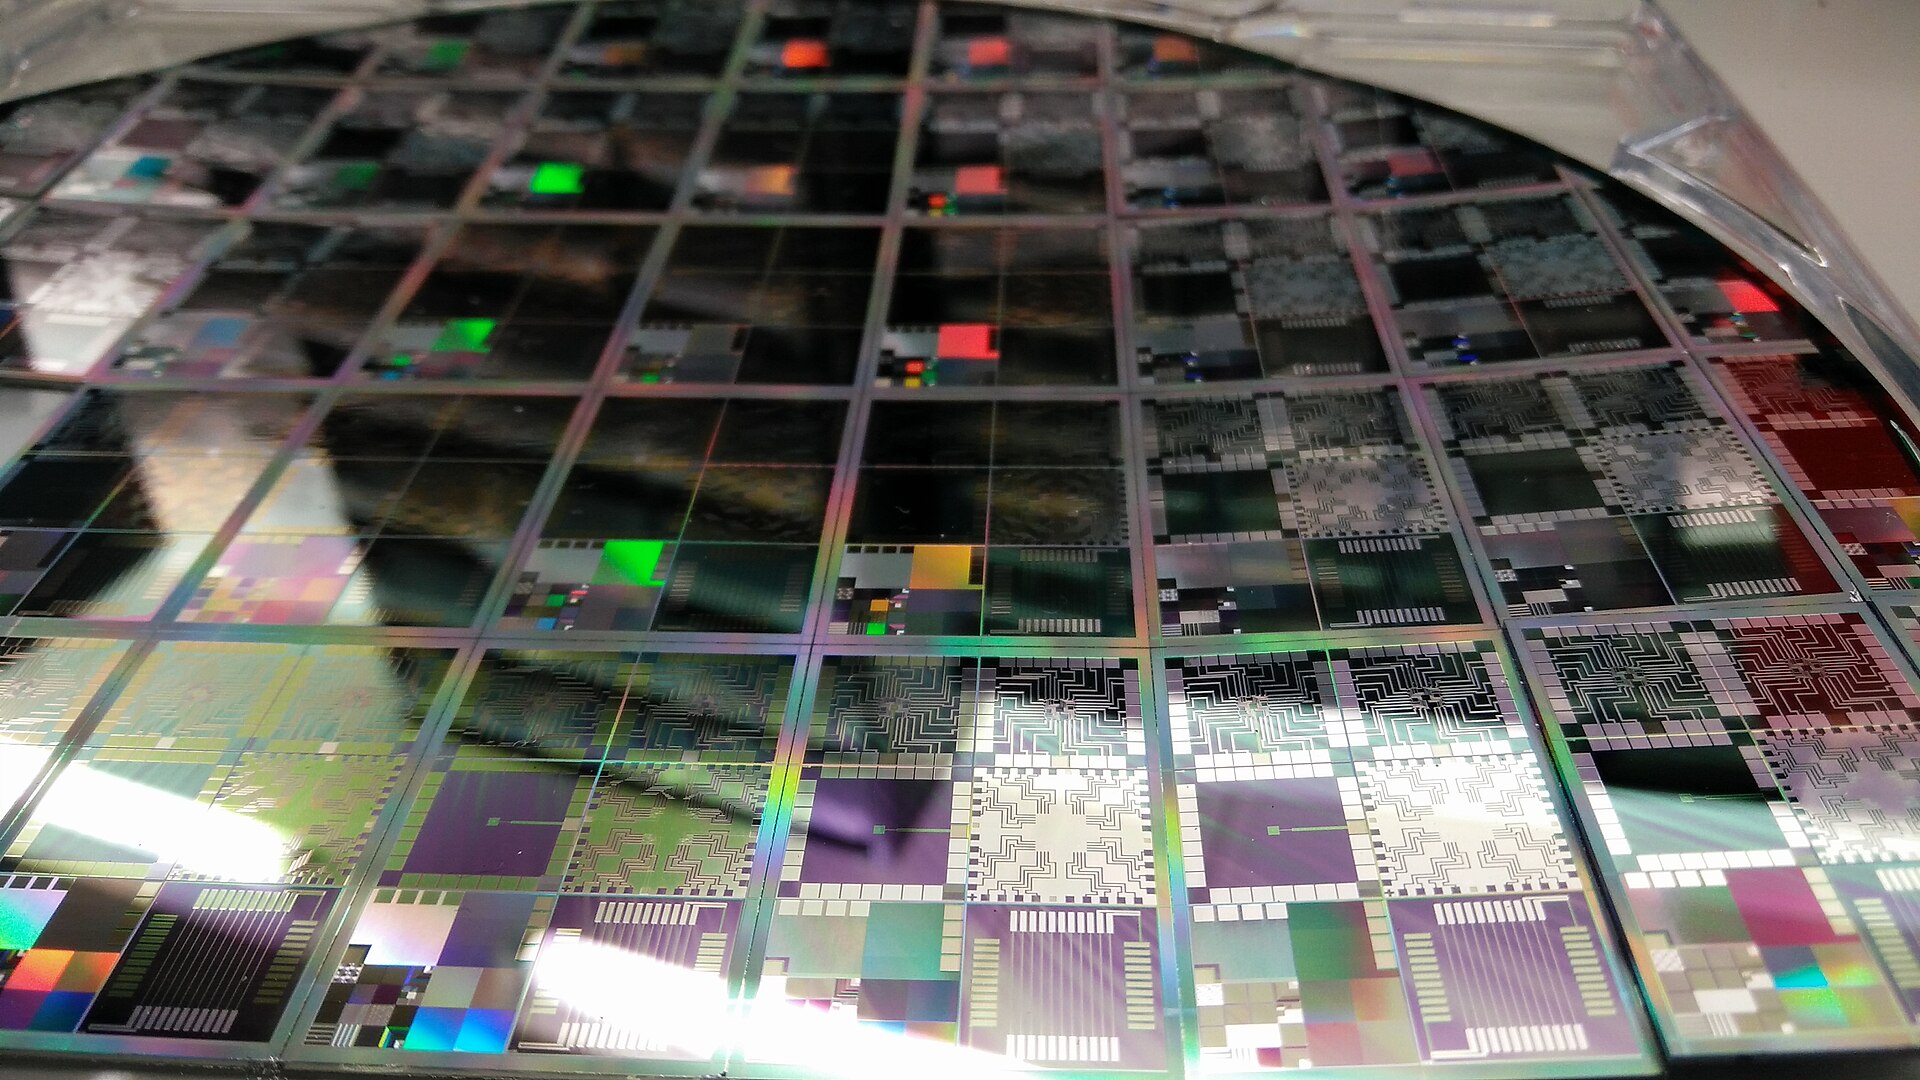
That data gap affects comparison. A detailed bill of materials may identify aluminium, copper, gold, rare-earth elements and plastics, yet the emissions factor for a material still depends on source, recycled content, refining method and geography. A supplier-specific figure can improve accuracy if its boundary and verification status are clear. A broad database factor can support a first estimate, but it should be labelled as an estimate.
Durability changes the per-year result. A device used for six years spreads its production emissions across more years of service than an identical model retired after two. Repairing a controller or replacing a storage drive can delay a full-device replacement. The benefit weakens if repair requires a new product with a large footprint or if a repaired item sees little further use.
Operational emissions depend on use and place
Calculate use-phase emissions as measured kWh multiplied by a factor for the place and period of that electricity use. Keep the factor type beside the result: an annual grid average supports an annual inventory, while a time-specific signal addresses a different question about scheduling. Do not apply a New Zealand factor to a server or player device operating overseas.

Use scenarios matter as much as the electricity factor. A high-performance mode can raise power demand; a low-power menu, frame-rate cap or shutdown setting can reduce it. A larger screen or extended play period changes the total. Carbon comparisons should state hours, settings, display assumptions, years in use and whether idle time is included.
Cloud and online services need careful allocation
Cloud gaming moves rendering to a server and streams video to the player; online play without streamed graphics can send much smaller gameplay messages but still needs hosting and related services. Compare matched games, resolution and session length across server, network and client. Shared-server energy may be allocated by users, sessions or compute demand, so disclose the denominator and utilisation.
Renewable purchases can change market-based emissions accounting without removing physical electricity use. A carbon claim should say whether it covers a session, product, operations or the value chain, and report direct reductions, certificates and credits separately.
Compare products without hiding trade-offs
| Question | Useful evidence | Common source of error |
|---|---|---|
| Which device uses less during play? | Measured kWh for the same game, settings and session | Comparing different scenes or excluding the display from one setup |
| Which has lower life-cycle emissions? | Manufacturing, use, shipping and end-of-life boundary | Using electricity alone as the complete footprint |
| Does a longer life help? | Years of useful service, repair and replacement history | Assuming a device lasts longer without evidence of continued use |
| Is a cloud service lower carbon? | Server, network and client data for the same service quality | Counting the client device but omitting remote infrastructure |
For two console generations, compare the same game at a stated frame rate and display, then add annual standby hours and expected years of ownership. Put the new device’s manufacturing estimate beside the use-phase saving. If the newer model saves 10 kWh a year but has a substantially larger production footprint, the conclusion depends on how long it remains in use; an annual power figure alone cannot settle the replacement decision.
Use a transparent estimate for a product or household
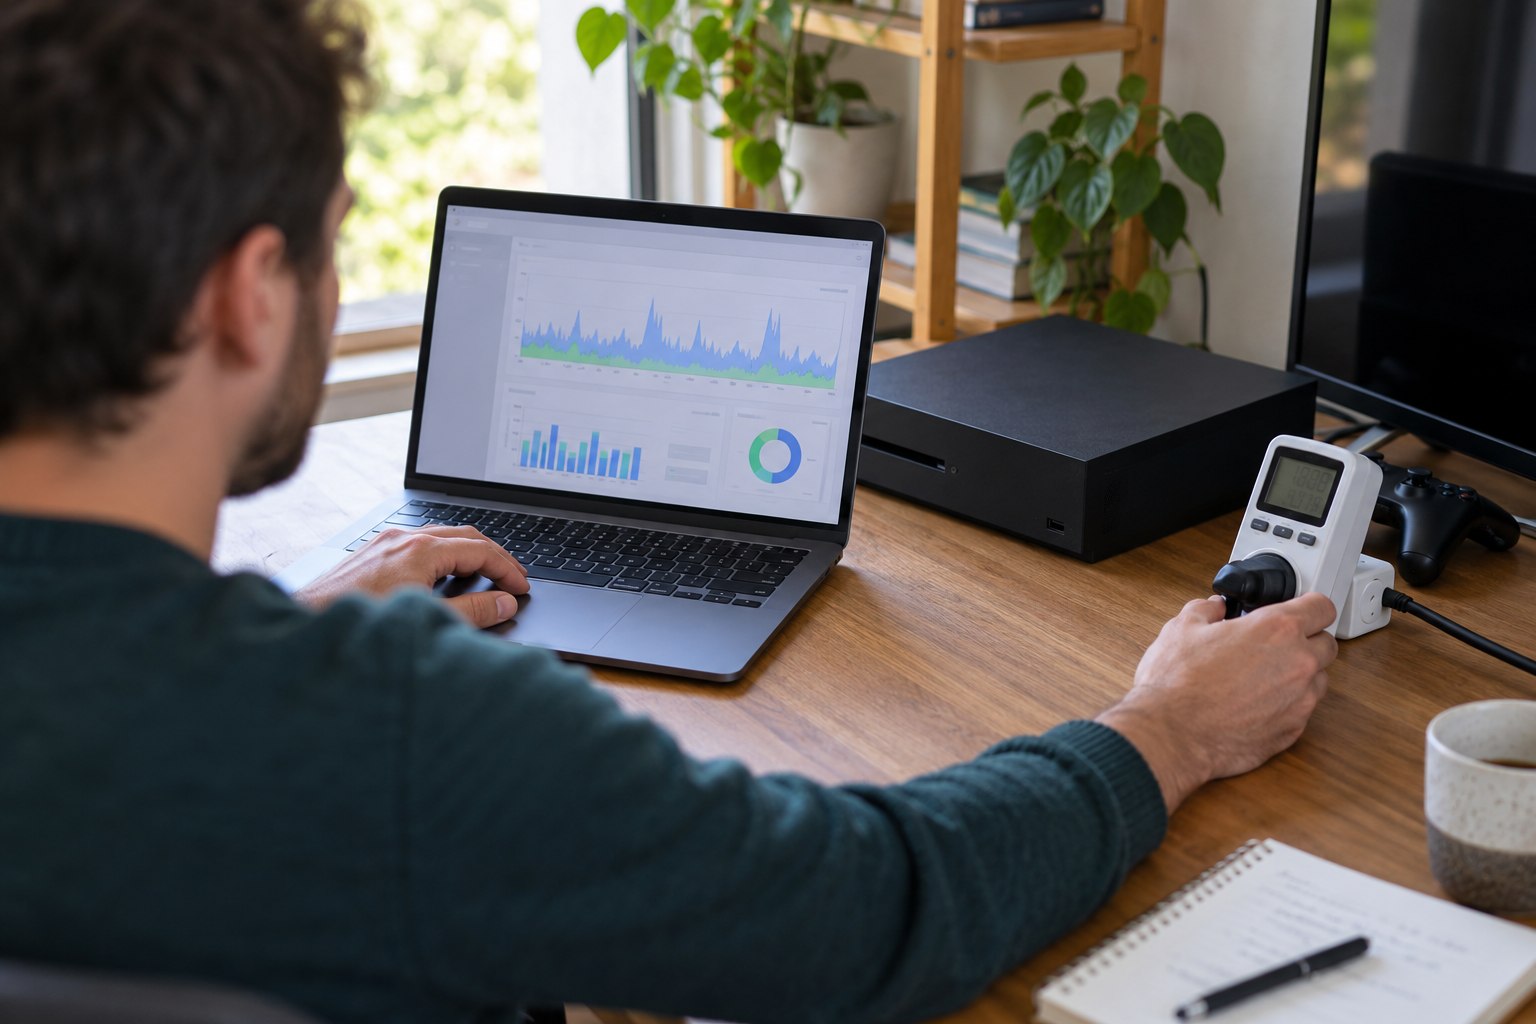
A household can estimate operating emissions by logging kWh for the console or PC, screen and any gaming-only equipment, then applying a dated electricity factor appropriate to the selected method. An embodied estimate requires a life-cycle figure from the maker or a model built from materials and manufacturing assumptions. Keep those two layers separate before combining them.
- Name the product, region, period and functional unit.
- State whether manufacturing, freight, electricity, network services and disposal are included.
- Record play hours, device settings, rest-mode hours and expected product life.
- Identify measured values separately from estimated or supplier-average values.
- Show the emissions factor, data year and accounting method beside the result.
Sensitivity ranges are more honest than a long decimal when manufacturing data or player-use assumptions are uncertain. A high and low scenario can show whether the ranking changes when lifetime, grid intensity or server allocation changes. If the conclusion flips under small changes, the available data do not support a confident winner.
Corporate targets need absolute and intensity measures
A company can report both total emissions and an intensity measure such as emissions per device, active user or revenue unit. Intensity shows efficiency relative to growth; absolute emissions show whether the total burden is rising or falling. A fast-growing company can improve intensity while its total footprint grows. Both numbers need a consistent organisational boundary and a method for acquired, outsourced or discontinued activities.
Progress claims should distinguish reductions inside the value chain from avoided emissions, offsets and changes caused by revised data. A target year, baseline year, scope coverage and interim milestones make a promise assessable. Product energy savings are most useful when linked to units sold, actual use assumptions and the expected time users keep the hardware.
For entities inside the reporting regime, an inventory file needs a stable organisational boundary, base year, calculation method and restatement policy. Small studios may need the same fields when publishers request supplier emissions data, even when no equivalent statutory duty applies to them.