Measuring Gaming's Environmental Impact
A gaming footprint is an account of a defined activity, not a property of a product label. A console’s electricity during play is different from its manufacturing footprint; an online game’s server activity is different from a player’s full setup; a casino’s gaming floor is different from its hotel. Good environmental evidence begins with a question that a measurement can answer.
A useful first account separates measured office electricity, estimated player-device use, cloud workloads and hardware purchases. Each row needs its own place, period and data source. A New Zealand office meter cannot stand in for an overseas hosting region or the homes of international players.
Choose the decision before selecting the metric
A useful measurement question identifies an object, a comparison and a boundary. “Which device is more efficient?” needs the same game, resolution, display and session. “Which service has a lower footprint?” needs server, network and client activity. “Did the venue reduce energy?” needs a baseline and an adjustment for opening hours, occupancy and weather.
The unit of analysis should match the decision. kWh per session can compare play routines; emissions per console sold can compare products; water per server-hour can assess a data-centre workload; waste per occupied room can track a resort. A metric that divides by revenue may be useful to investors but can hide environmental change when prices or sales mix move.
Absolute totals belong beside intensity measures. Efficiency per player-hour can improve while total energy rises because more people play. A resort can use fewer litres per room but consume more overall after adding rooms. The paired measure shows whether the operation has reduced total pressure or only improved output efficiency.
Set system boundaries in layers
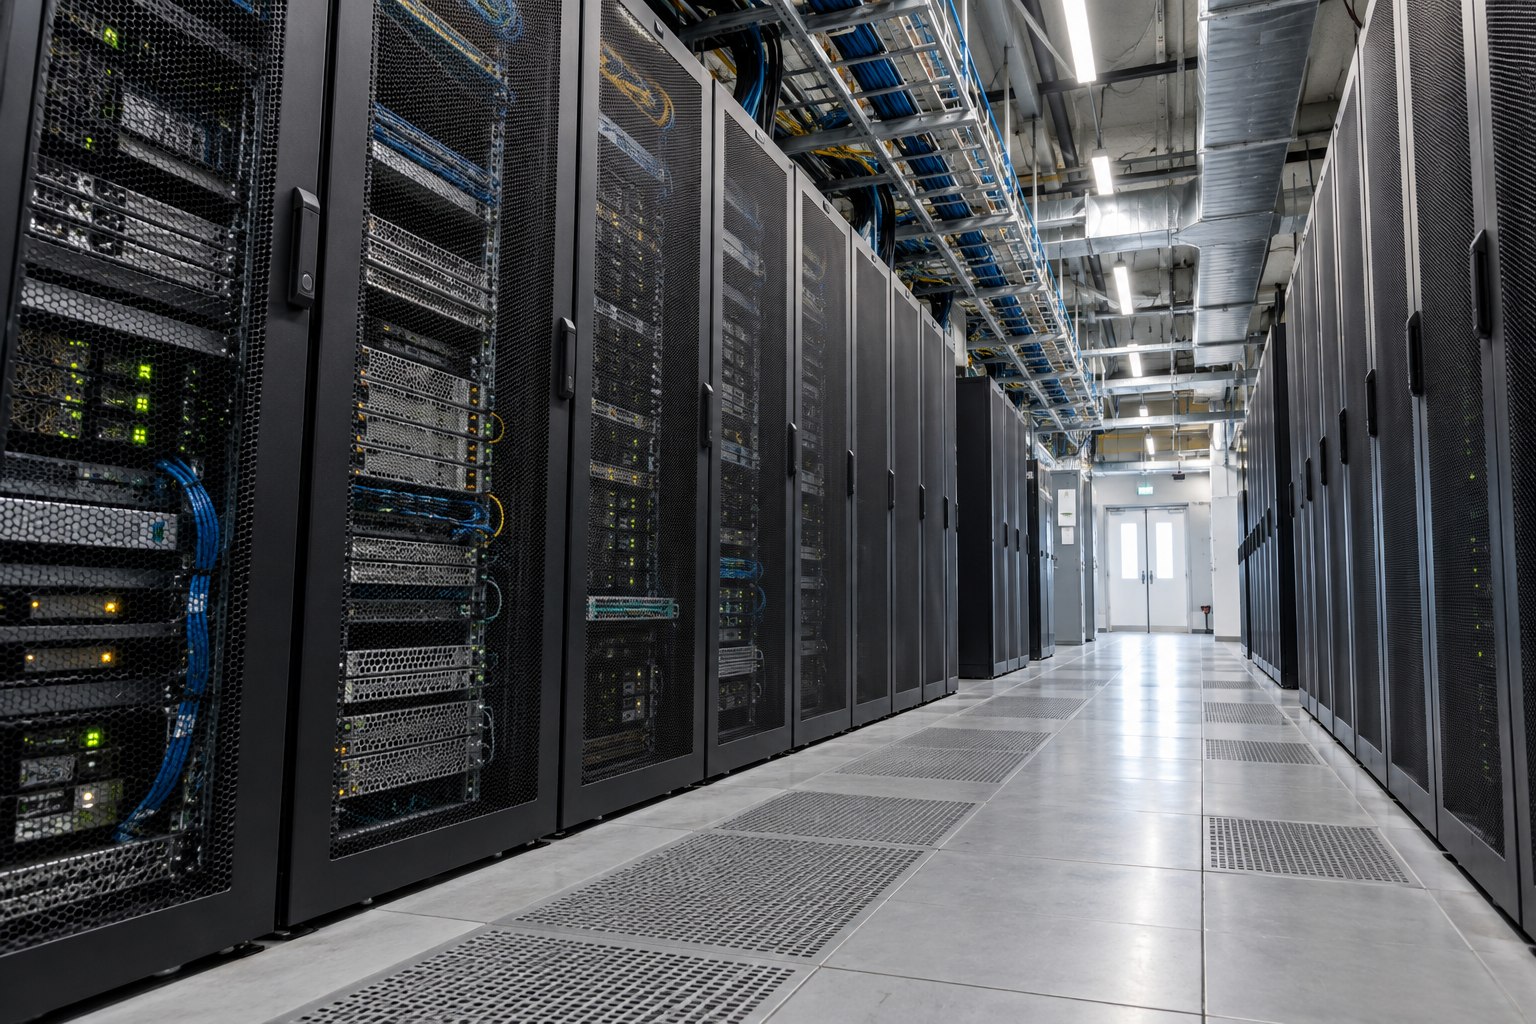
A gaming product lifecycle can include materials, component fabrication, assembly, distribution, use, repair and end-of-life. A digital service can include software development, data centres, networks, payment and security systems, player devices and supporting offices. A land-based casino can include the building, gaming equipment, cooling, kitchens, hotel areas, staff transport and visitor travel.
Not every account needs every layer. A console power-setting test can exclude manufacturing if the question is strictly about operating electricity. A public product footprint cannot then be used as a full life-cycle comparison. A platform report can exclude customer equipment if it names that boundary and avoids claims about the whole player experience.
Shared resources need allocation. One router serves many household activities; one data centre hosts many customers; one hotel shares HVAC with the gaming floor. The allocation method - time, compute, floor area, data volume, occupancy or another driver - should be documented and kept stable across the comparison.
Does a power mode save electricity?
- Core measure
- kWh across equal active and idle periods
- Important boundary note
- Record features still running in each mode.
Which platform has lower operating emissions?
- Core measure
- kWh by component multiplied by a stated factor
- Important boundary note
- Keep the display, network and region consistent.
Is cloud gaming lower impact?
- Core measure
- Server, facility, network and client use
- Important boundary note
- Match game quality, duration and device purpose.
Is an e-waste programme effective?
- Core measure
- Items collected, reused, recovered and disposed
- Important boundary note
- Collection is not the same outcome as material recovery.
Did a venue retrofit work?
- Core measure
- Total energy plus weather and occupancy-adjusted use
- Important boundary note
- Separate operating changes from technical savings.
Separate direct readings from modelled values
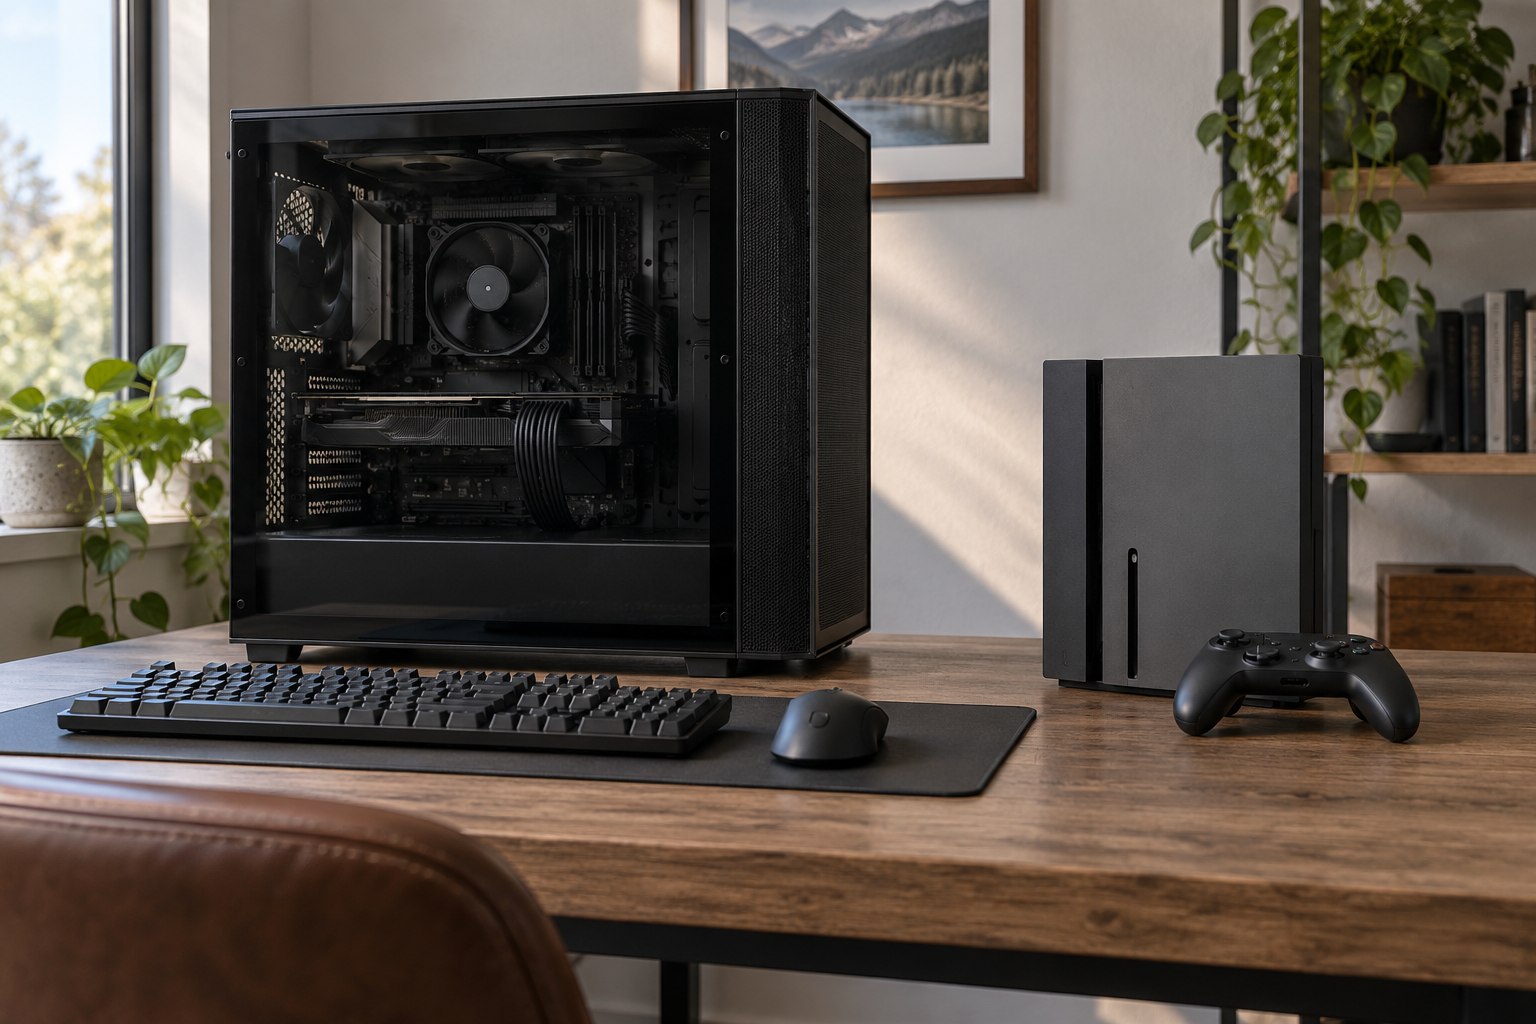
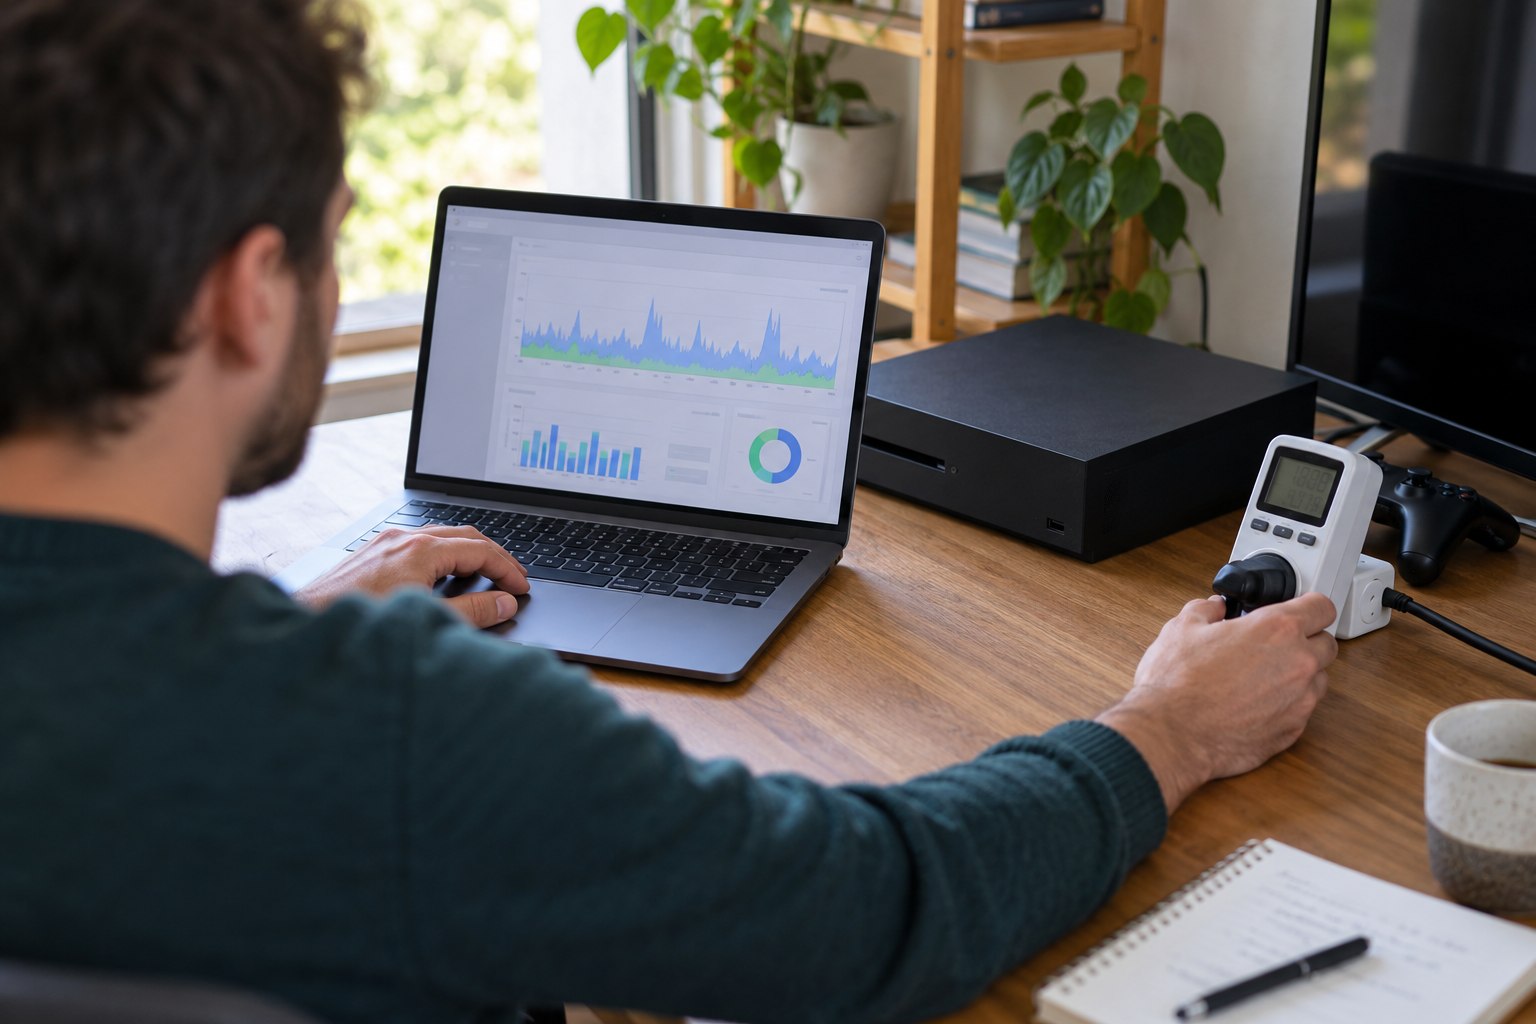
A wall meter can record electricity for a console or PC. A building invoice can show whole-site energy. A server provider may report facility data, while a game publisher estimates player-side use from device profiles. Those values differ in proximity to the activity. An estimate can still be useful when its data source, assumptions and uncertainty are visible.
For a product lifecycle, manufacturers may use supplier data, material inventories, average emission factors and assumed lifetime use. The quality depends on supplier specificity, geography, technology and whether the number has been independently verified. A broad factor can support an initial account; it should not be presented as a precise factory measurement.
New Zealand’s greenhouse-gas inventory provides a national accounting view of emissions and removals within the country. It is not a calculator for one gaming session or a product made overseas. A company account can include value-chain emissions beyond the national territorial boundary, but those need their own method and data.
Time and geography change the result
Electricity emissions can be estimated with an annual average, a supplier-specific instrument or a time-specific signal. These methods answer different questions. Annual factors suit broad inventories; time-matched signals suit flexible workloads; a physical meter records energy but not emissions. The selected method should be named alongside the result.
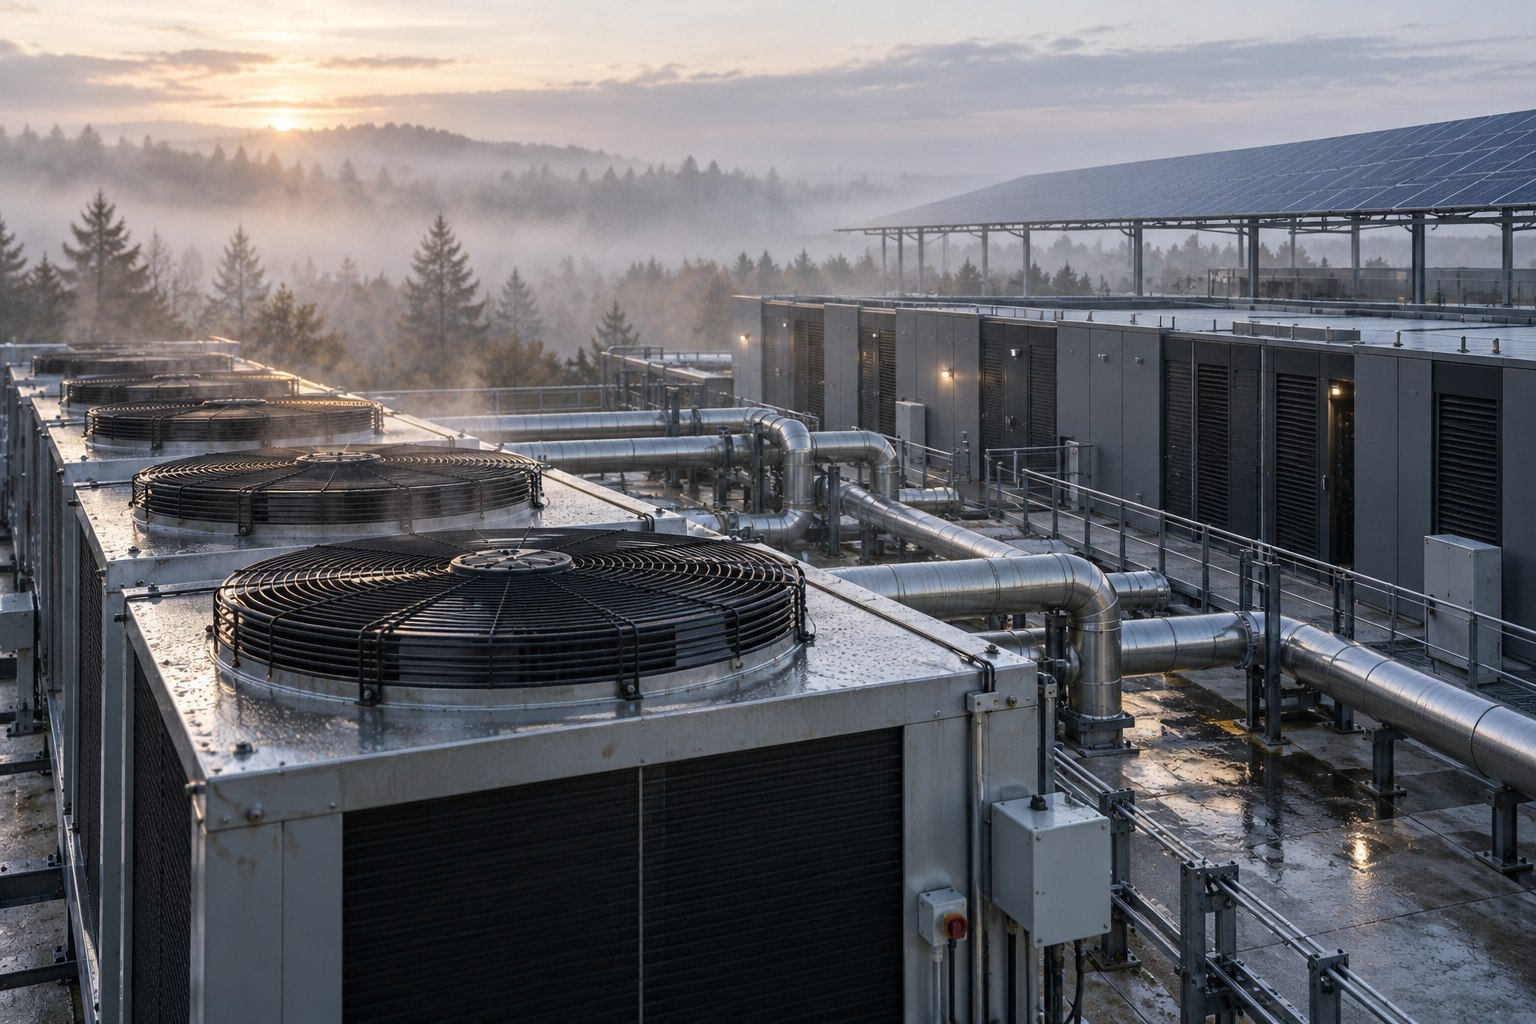
Water measures need a basin and season. Withdrawal, consumption and discharge describe different flows. A facility using reclaimed water in a water-abundant region cannot be compared with one drawing potable water in a stressed catchment on the basis of a single global facility average. Local conditions determine whether the same volume creates similar pressure.
Data centre location may change during a service contract. A game can be hosted in one region during development and another when player traffic grows. The reporting record should identify service regions and the months they were active. If the provider supplies only a regional average, state the geographic resolution and any uncertainty.
Sampling must represent actual use
Test devices across representative games, settings, scenes and idle states, with repeated runs that reveal background variation. Record the hardware, firmware, driver, display and network conditions. A showcase scene can overstate normal play just as a menu can understate it.
Sample households across ordinary weeks, studios across a production cycle, and venues across different event and occupancy days. Include release peaks, tournaments and holidays where they drive load; one quiet month or convenient weekday cannot represent a year.
Uncertainty is part of the result
Missing supplier data, shared infrastructure, device lifetime, grid factors and user behaviour can change a result. Show a range when key assumptions are weak and label measured kWh, supplier figures, modelled averages and projections separately; decimal precision is not evidence quality.
- Cloud: test low and high server utilisation when the actual value is unavailable.
- Hardware: compare plausible service lives, such as three and six years, before ranking products.
- Interpretation: if the preferred option changes across plausible assumptions, report that sensitivity rather than a single winner.
Independent checking and repeatability
Verification can examine data collection, calculation rules, source documents and whether the stated boundary matches the published claim. A third-party review can improve confidence, but it cannot repair a boundary that excludes a material part of the service. The verifier’s scope and assurance level should be stated.
A repeatable protocol records the procedure, instruments, software version, energy factors and calculation formulas. Another operator should be able to reproduce the result from those details or understand why a different system produces a different value. Stable methods allow a trend to be separated from a change in measurement technique.
When the method changes, retain a bridge year or recalculate previous periods where practical. A new supplier dataset may add server regions that were previously omitted; reported emissions may rise even when physical activity did not. A transparent restatement protects the meaning of the time series.
Build a gaming-specific evidence file
- State the user or business decision the measure is intended to support.
- List the product, workload, site, time period and included activity.
- Label readings, supplier disclosures, estimates and scenario values separately.
- Record the factor, allocation rule, sample and uncertainty range.
- Keep the source record with each result and review it when the operation changes.
For a gaming company, the evidence file can link product models to energy profiles, cloud regions to service workloads, and retired devices to reuse or recycling records. A corporate climate inventory can draw from the file without losing the detail behind each number. Procurement, engineering and sustainability teams can use the same dataset for different decisions.
Suppose a studio is choosing whether to extend a workstation fleet by a year. Record current device kWh, repair cost, failure rate, expected replacement energy and the production footprint of new machines. Those metrics answer the replacement decision. A generic company emissions total cannot show whether the one-year extension saves more than it costs.
Use New Zealand sources for New Zealand questions
New Zealand environmental reporting can describe local greenhouse-gas trends, freshwater condition, electricity generation and waste rules. Those sources establish the national setting. They do not replace site-specific measurements for a studio, venue or data centre, and they cannot characterize the overseas factories that made imported devices.
Water allocation records can be inconsistent among regions, with differences in metering and data formats. A business operating across several regions should keep source-specific data rather than combine all sites into one number without qualification. The same logic applies to power factors, council waste routes and local building requirements.
When an estimate mixes utility bills with supplier models, keep raw meter data separate from calculated values. Note the factor year, region, activity data and uncertainty range so a future review can update the model without rewriting the underlying observation.