Water and Materials in Gaming
Gaming’s water footprint is mostly out of sight. Water is used to manufacture semiconductors, cool some data centres, generate electricity in certain systems and produce the metals and plastics found in devices. The player may see a console, handheld or streamed image; the resource chain extends from mines and factories to power stations and server sites. A single national water figure would conceal those different locations and uses.
Material demand begins with the product itself. A console or gaming PC contains circuit boards, processors, memory, cables, housings and power components. A phone adds a battery, display and compact electronics. Longer service life and effective recovery can reduce demand for replacement materials, although repair and recycling have energy, transport and processing requirements of their own.
Water enters the chain at several points
Semiconductor production uses ultra-pure water for cleaning and rinsing wafers. A fabrication plant may withdraw water, treat and reuse some of it, then discharge treated water under local rules. The quantity withdrawn is different from the quantity consumed. A withdrawal measure records water taken from a source; a consumption measure tracks water not promptly returned to the same source in a usable form.
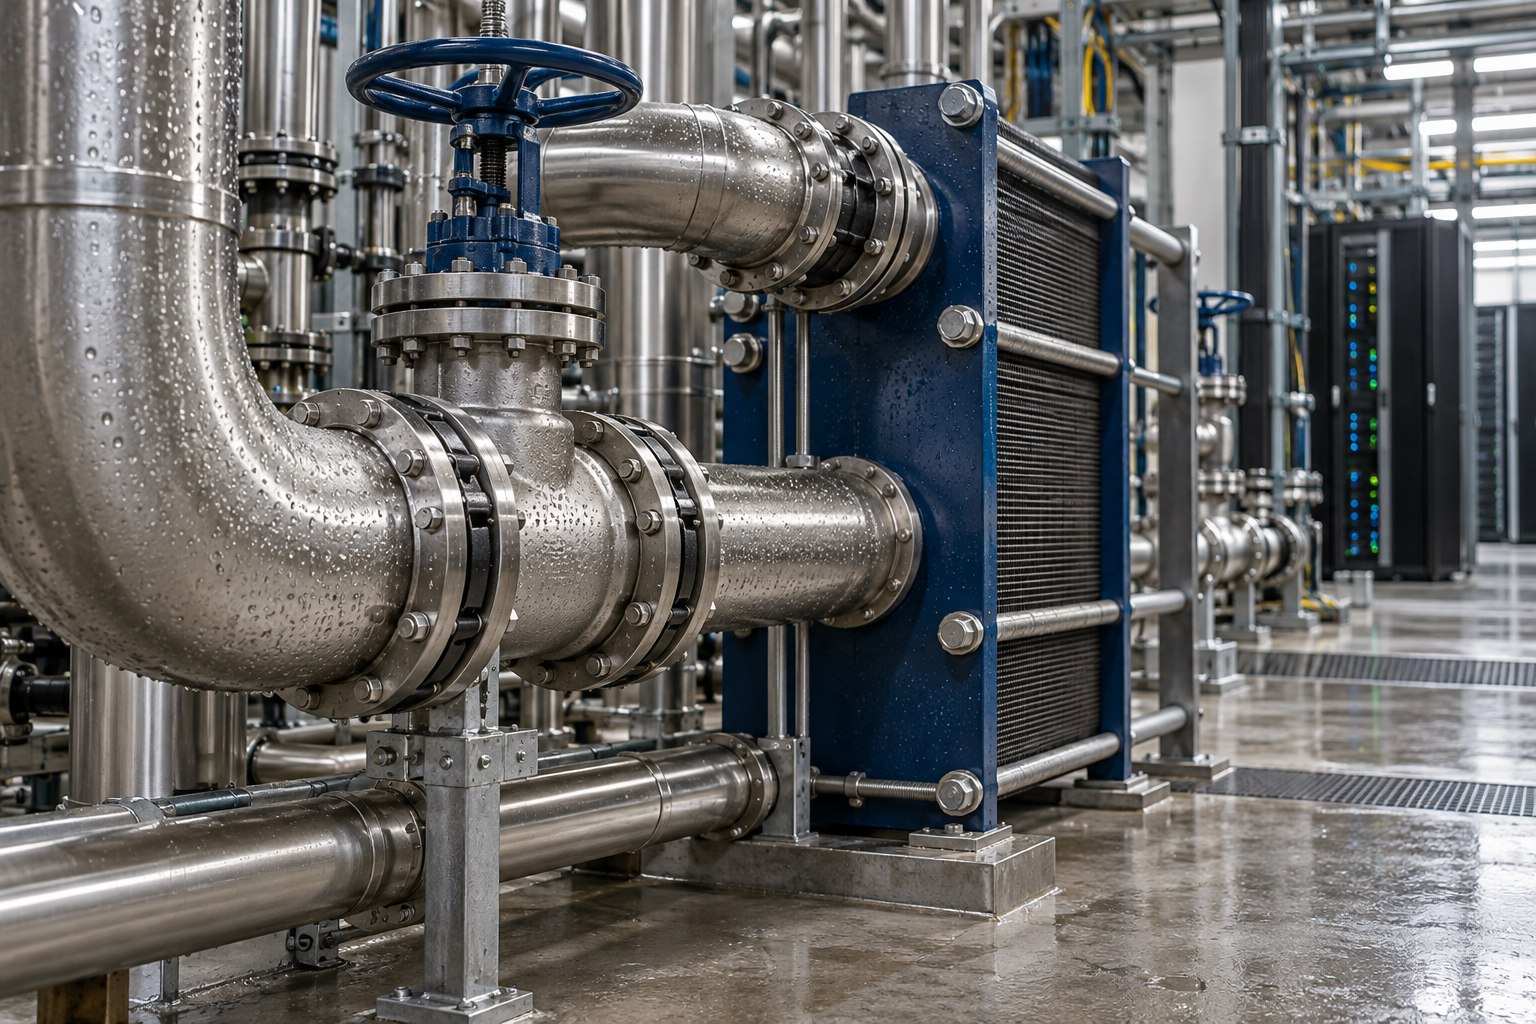
Data-centre cooling can involve evaporative systems, chilled water loops, air cooling or combinations that change by season and site. Evaporative cooling can reduce electricity demand while consuming water; dry cooling can reduce direct water use while raising electricity needs during hot periods. The preferred design depends on local climate, grid emissions, water availability, equipment density and the operating profile of the servers.
Electricity supply carries an indirect water footprint. Hydroelectric reservoirs alter water storage and flows, while thermal generators may use water for cooling. Wind and solar have different operating water needs, yet their equipment also requires material extraction and manufacturing. “Renewable electricity” does not mean zero water impact at every stage.
Location can matter more than a global average
A litre consumed in a water-stressed catchment can create a different local pressure from a litre used where water is abundant and replenished. Seasonal timing matters as well. A facility’s annual water total can conceal summer peaks that overlap with low river flows, restrictions or household demand. Data about source, month, basin and replenishment are necessary to understand local consequences.
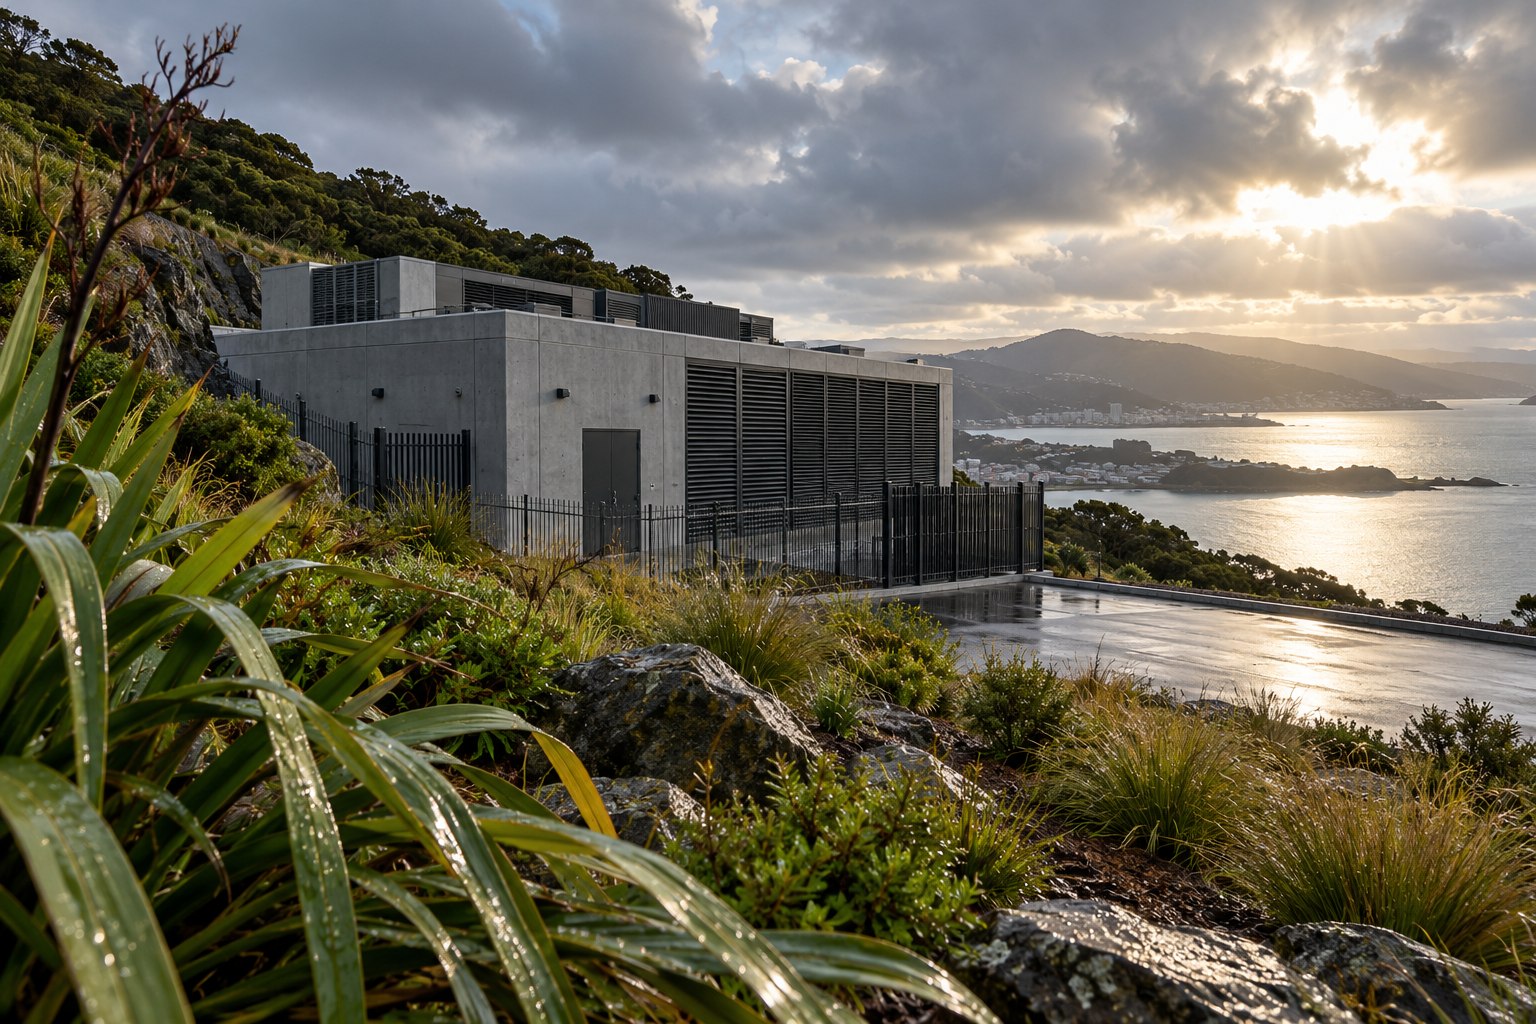
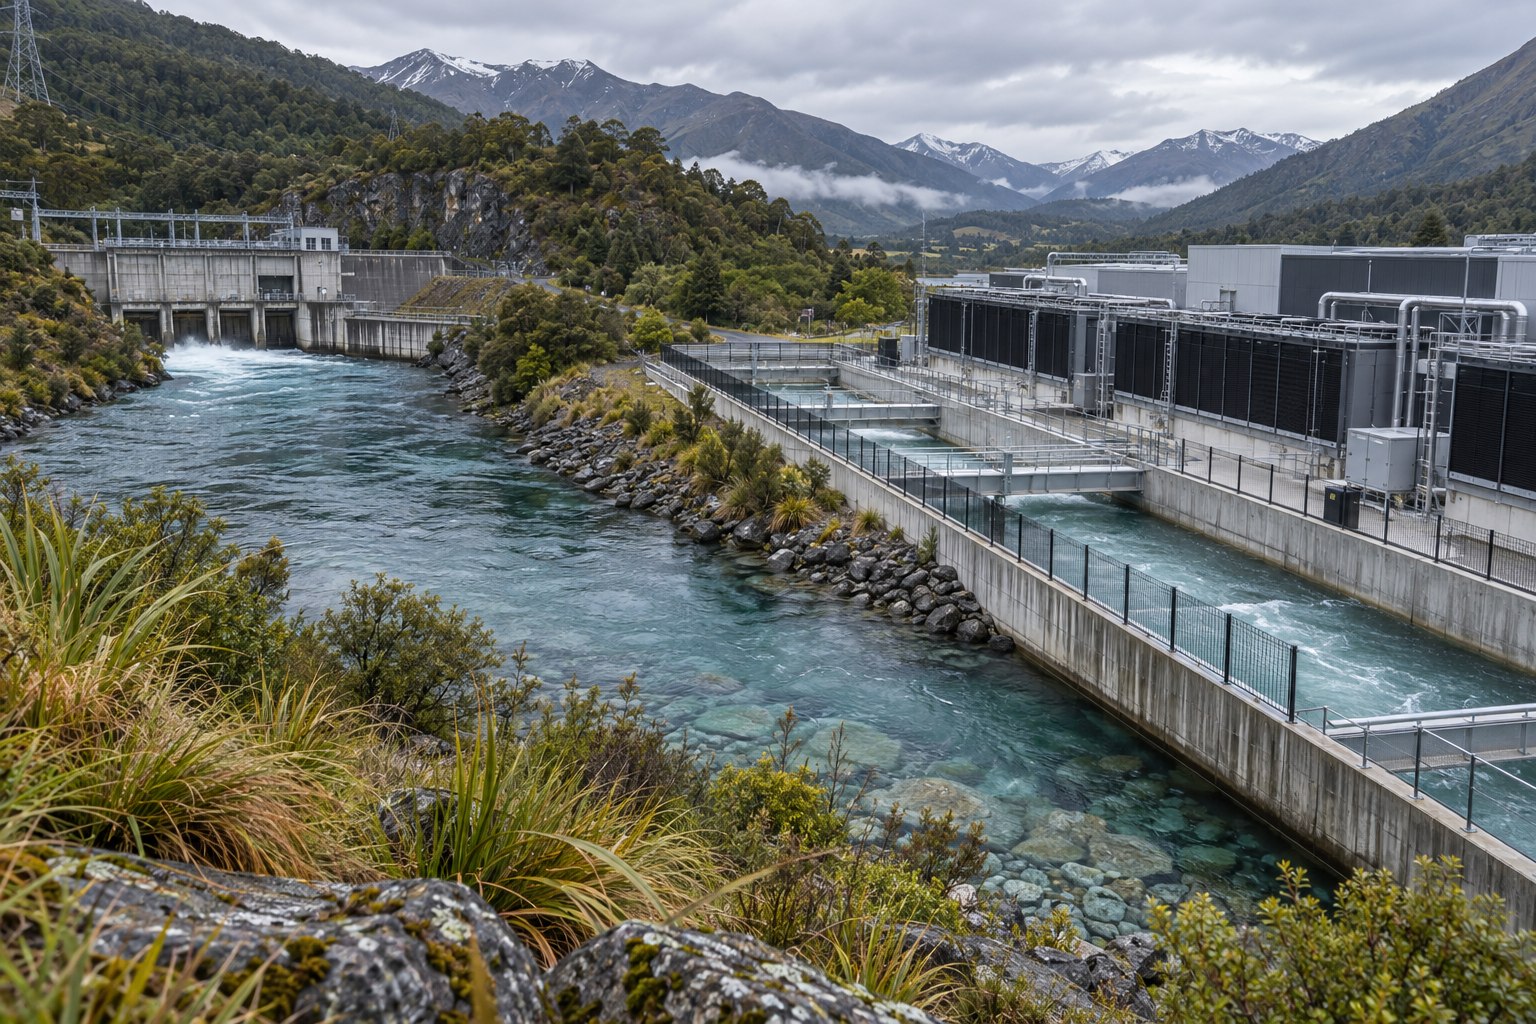
New Zealand’s freshwater systems are under pressure from land use, contamination, abstraction and a changing climate. Groundwater can respond slowly, with effects that persist beyond a single operating year. The Ministry for the Environment’s 2026 freshwater reporting describes connections between groundwater, river flows, drinking-water security and ecosystem health. Those conditions make local catchment context relevant to any water-intensive facility, including digital infrastructure.
National totals are not a substitute for site information. New Zealand water-use data have gaps in metering, formats and quality across regions. A facility should identify its water source, whether the quantity is measured or estimated, any consent or restriction, and the destination of discharged water. A “water positive” claim needs to state what replenishment project is counted and whether it benefits the same watershed and time period.
Read data-centre water metrics with their boundary
A useful data-centre water figure names the site, year, source and calculation boundary. A low facility ratio can coexist with rising total water use when compute capacity grows; a global average can also hide pressure in one catchment. Chip fabrication and materials processing may account for water use outside the data centre.
Read water beside facility and IT electricity, cooling method, climate and utilisation. Supplier data should identify the sites serving the workload; a company-wide average cannot be assigned to one game without a documented allocation rule.
| Metric or disclosure | What it tells you | What it leaves out |
|---|---|---|
| Water withdrawal | Volume taken from a source | How much is consumed, returned or reused |
| Water consumption | Water not returned to the same source in a usable state | Local scarcity unless basin and season are shown |
| WUE | Site water per unit of IT energy | Upstream water and changes in total workload |
| Recycled-water share | Portion supplied from reused sources | Quality, treatment energy and ecological effects |
| Catchment location | Place where direct use occurs | Impacts in the wider supply chain |
Materials have ecological and supply risks
Devices use copper, aluminium, steel, gold and specialist minerals in chips, batteries and displays. Extraction and refining can affect land, water, energy and pollution, but impacts differ by mine and processor. A generic mineral list cannot establish one device's footprint.
Reduce unnecessary material, use recycled content where it meets specifications, make parts replaceable and keep software supported. A lighter or recycled device is not automatically better if it fails early or cannot be repaired. Replaceable controller parts, standard PC components and available handheld spares can extend service life and avoid a full replacement.
Online play and cloud services add indirect demand
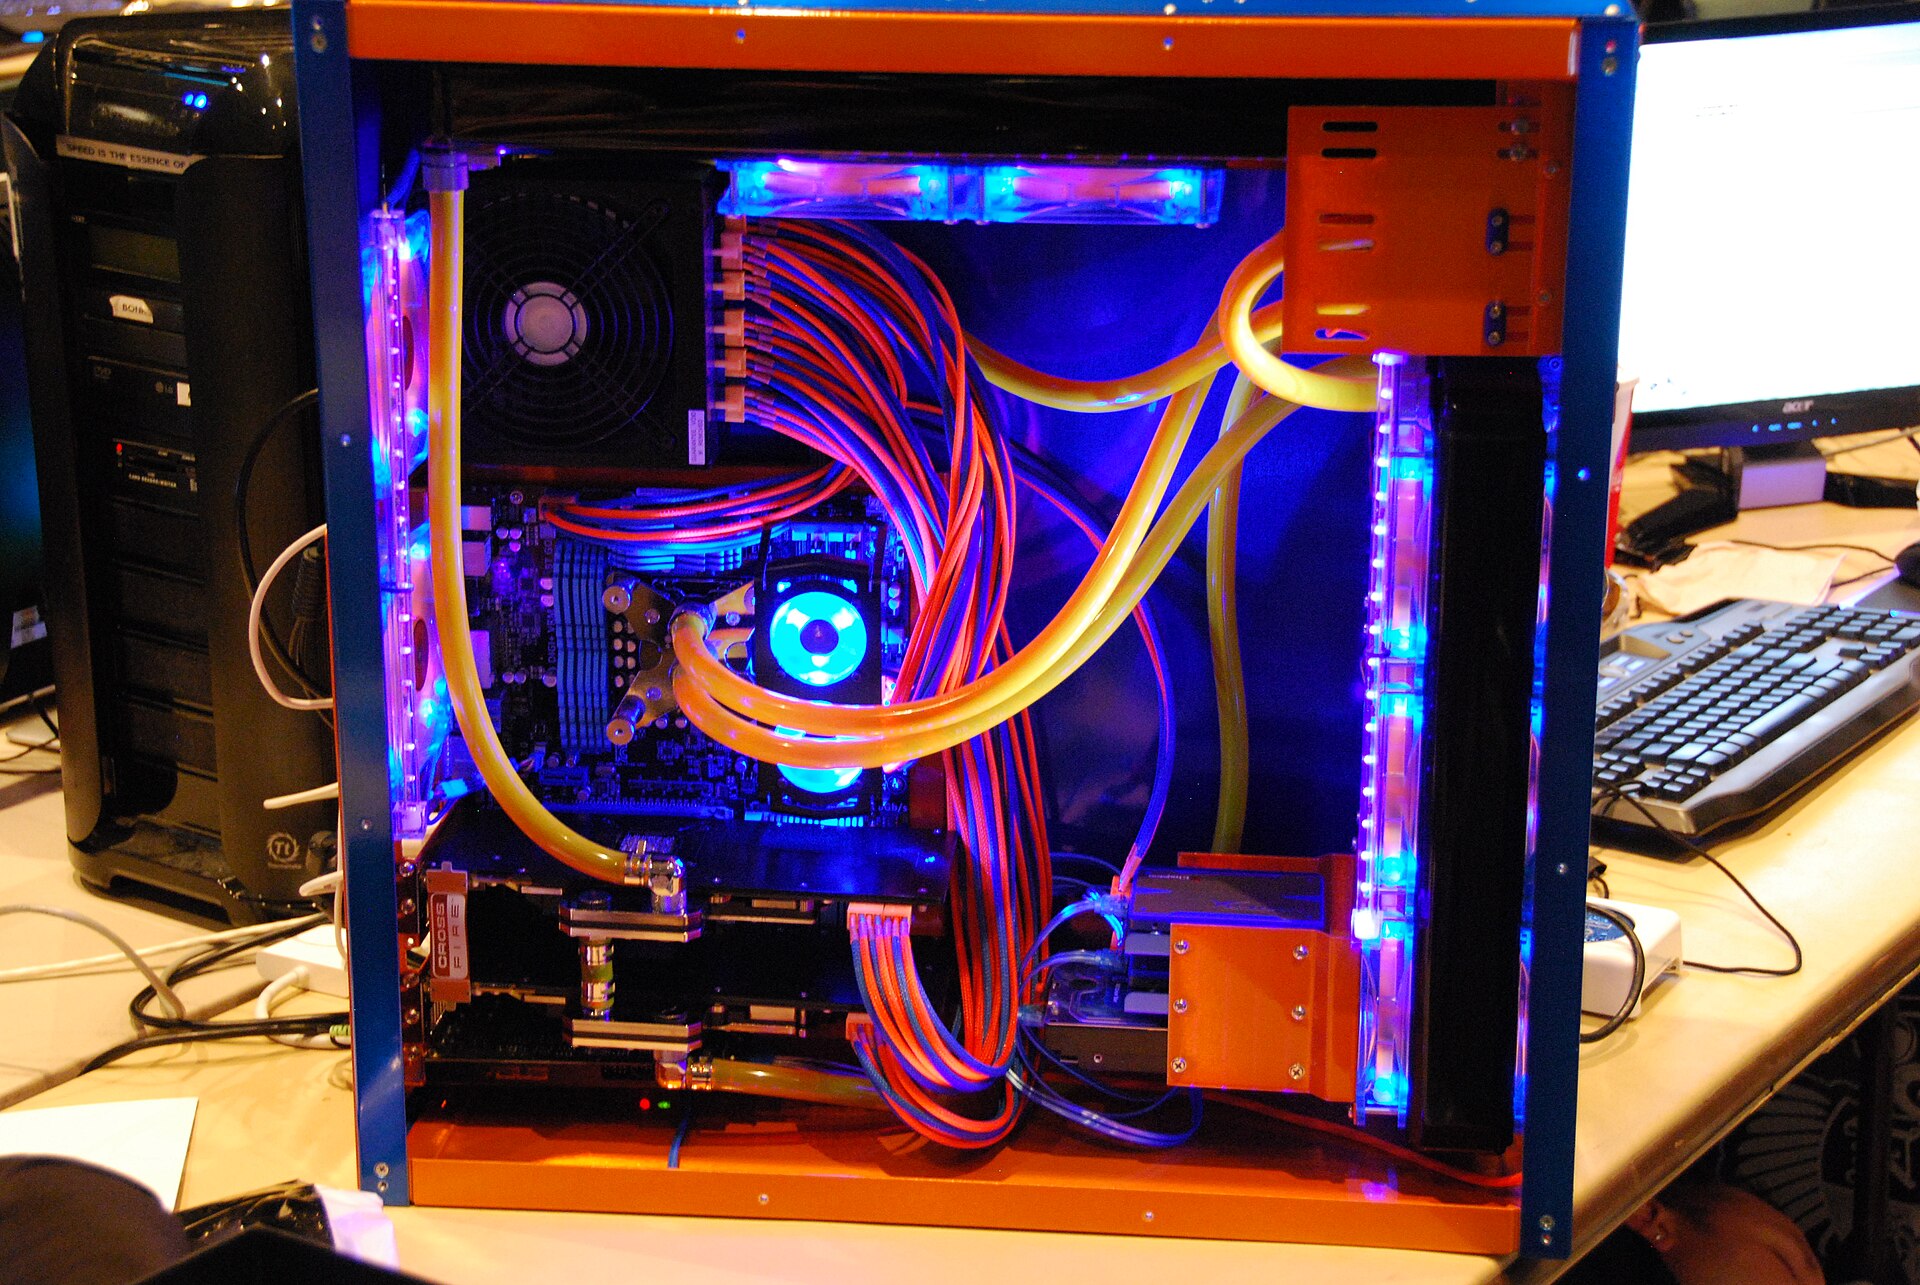
Online multiplayer adds networking; cloud play also adds remote graphics rendering and video delivery. A water estimate is useful only if the provider identifies the serving facility, its cooling-water source and reporting period. Authentication, storage and streaming can occur in different regions, so an account’s billing country does not locate the water use.
Data-centre growth can compete with local water and grid needs, but the outcome is site-specific. A facility using reclaimed municipal water in a temperate area has a different profile from one drawing potable water in a stressed basin. Cooling design, backup systems, server utilisation and seasonal peak management should be part of the same assessment.
Build a resource account that can be acted on
A practical inventory separates direct site water, purchased electricity, hardware purchased, hardware repaired and hardware retired. For a studio, record workstation and server locations, cooling arrangements, equipment turnover and the source of cloud-provider data. For a household, the most useful controls are usually longer device life, repair, thoughtful upgrades and an appropriate screen and power profile.
- Record whether a water quantity is measured, modelled or estimated from a supplier average.
- Keep withdrawal, consumption, discharge and reused water as separate categories.
- Connect data-centre metrics to the facility location, reporting year and cooling system.
- Track hardware mass and product category rather than counting all devices as identical units.
- Pair recycled-content claims with repairability, useful life and end-of-life recovery information.
A resource account improves when the denominator matches the service. Water per server-hour, materials per device and total annual withdrawals answer distinct questions. Intensity can fall while total demand rises if a service expands. A facility can improve cooling efficiency and still increase water use when it adds capacity.
Trade-offs belong in the same comparison
Compare a proposed change across two columns: what happens at the site and what happens over the product or service life. Dry cooling may protect a stressed local water source while increasing electricity; keeping an older device avoids new materials but may use more power. Record the relevant catchment, season, kWh, replacement interval and uncertainty before ranking the alternatives.
Comparisons become stronger when they show both the local resource pressure and the life-cycle total. A water-scarcity assessment should account for basin and season; a materials assessment should include extraction, recycled content, repair and end-of-life; a digital-service account should separate client, network and server loads. These dimensions can support one decision without being collapsed into a single score.
A data-centre water figure can mean water withdrawn, water consumed or water purchased for a site. If a supplier gives only an annual total, retain its boundary and any missing basin detail; those gaps affect how a New Zealand location can be assessed.