Online Casino Energy Use
An online casino screen looks lightweight: buttons, account balances, game graphics and a live table feed. The service behind it relies on persistent platform systems, server processing, storage, network equipment, authentication, payments, security and customer support. A player’s phone or computer adds a separate load. Measuring only the device or only the data centre gives an incomplete picture.
Online casino energy use is difficult to compare across operators because companies rarely publish electricity by service, workload or brand. Shared cloud capacity serves multiple customers, and a single operator can use different providers across regions. A useful account separates the physical infrastructure from the activity it supports, then identifies where the data is measured or estimated.
Platform processing is steady, not just session-based
Account, payment, fraud and game-record systems keep running between player sessions. Measure their baseline kWh over a complete week and keep it separate from compute that scales with rounds or streams. A per-session estimate then needs an allocation rule for this shared baseline.
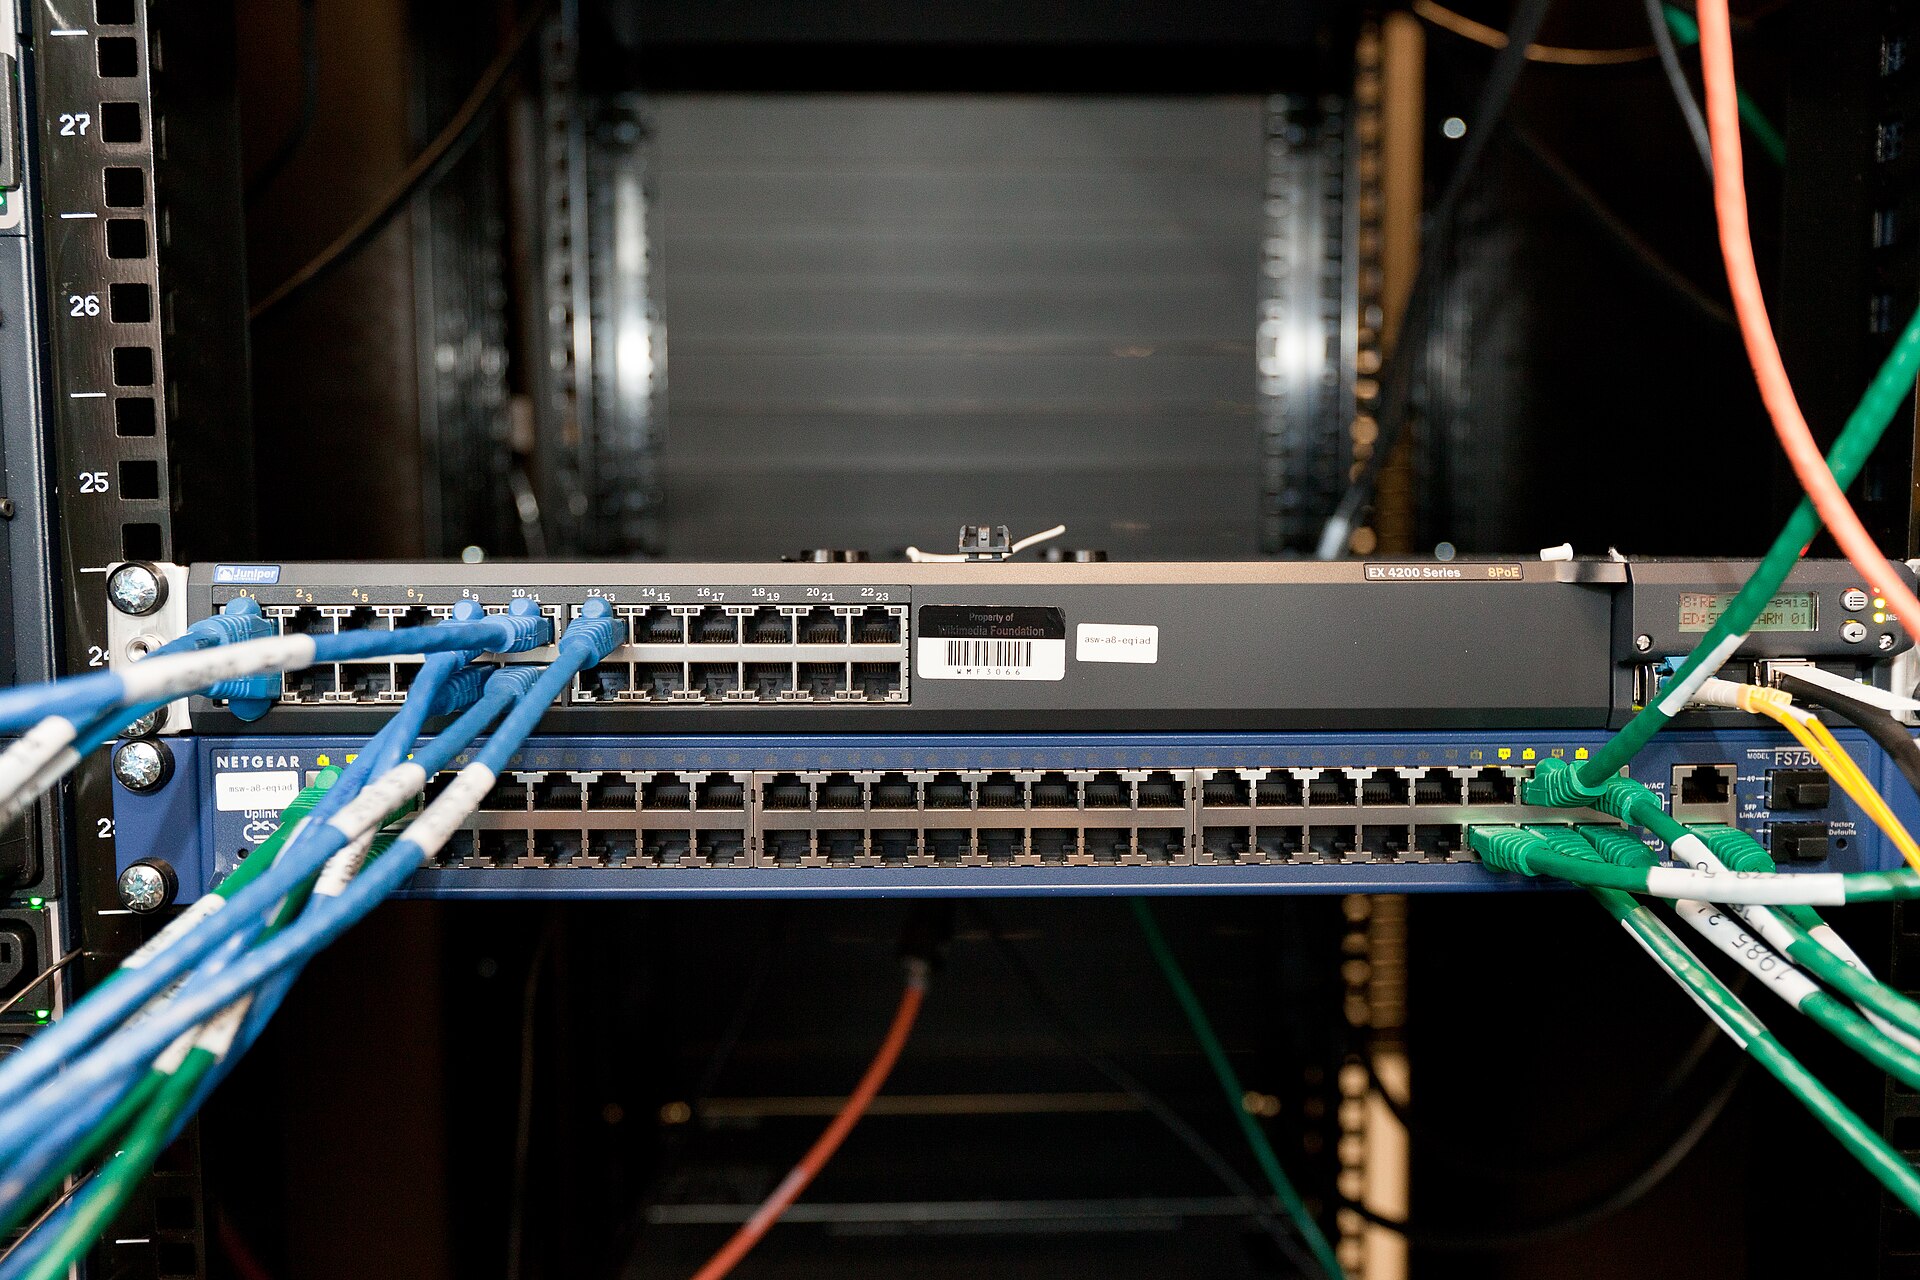
Workloads vary by game. A simple digital slot or table game can require modest graphics and server processing, while a high-resolution live stream adds video encoding, delivery and network traffic. Player counts, concurrent sessions, game logic, analytics and security controls also affect system demand. A per-round estimate that ignores idle capacity or services outside gameplay will undercount the platform.
Infrastructure design changes the relationship between service volume and energy. Virtualisation and containerisation can consolidate workloads, while autoscaling can adjust resources as traffic moves. Over-provisioning, poor code efficiency and idle servers increase demand. Capacity planning must retain enough headroom for reliability and peak loads; running systems too close to their limit can create outages or degrade service.
Casino platform workloads have different operating patterns
A wallet transaction, identity check and retained game record each has a different driver. Count transactions for payment services, active accounts for persistent security and game rounds for game logic; do not divide every shared system by game minutes. The denominator should reflect the load that actually causes capacity to change.
Keep fixed availability load and variable play load in separate rows. If player sessions decline while the same compliance systems stay online, energy per session may rise even though total kWh falls. Report both the service volume and the absolute electricity before interpreting that ratio.
Live-dealer services add production loads that do not belong in an ordinary game-server estimate: cameras, studio lighting, audio, encoding and a human operating team. Assign them to a live-table product line using a stated rule so that a low-bandwidth account game does not absorb the broadcast footprint of a shared studio.
Ask hosting suppliers whether a quoted figure covers IT equipment only or the full facility, and whether it includes reserved but idle capacity. Keep the answer beside the service description. One generic overhead factor cannot represent round processing, live video and account-security workloads with different utilisation patterns.
Networks and player devices add a second layer
An online session uses access networks and shared household or mobile equipment as well as the operator's servers. Static games and live video have different data demands; assigning a router's full annual electricity to one app would exaggerate its share.
- Client: estimate handset or display use with assumptions for brightness, radio conditions and session length.
- Transfer: report data volume and network model separately from server energy.
- Edge: assess caching with traffic volume, hit rate and regional cache power; shorter transfers still add servers.
| Activity | Useful unit of work | Energy data needed |
|---|---|---|
| Game logic and transactions | Completed round or transaction | Compute time, server energy and background capacity |
| Live video delivery | Streamed minute at a defined quality | Encoding, CDN and network activity |
| Account and security services | Active account-hour or verification event | Shared platform workload and retention period |
| Customer device | Session-hour on a stated device class | Measured or modelled handset or computer power |
| Facility overhead | IT kWh or service volume | Cooling, power systems and facility total |
Choose a metric that reflects the service
Energy per active session is easy to understand but may treat a short game round and a long live stream as equivalent. kWh per streamed hour works for video delivery but not account verification. Compute energy per transaction can track backend efficiency while missing customer-side electricity. No denominator covers every service function.
Operators can publish a small set of related measures: total annual electricity for owned sites, cloud-provider energy where available, network data transferred, workload volume and an intensity indicator suited to each service. Facility-level ratios may supplement the record, but they cannot allocate shared site demand to one casino platform.
Allocation method should be stable over time. Shared systems can be divided by CPU time, storage, data transfer, active accounts, estimated share of peak capacity or another documented rule. A material change in allocation can make a trend appear to improve even when the equipment and workload have not changed. Recalculation or a bridge between methods keeps the comparison usable.
Efficiency work starts with software and capacity
Code profiling can identify repeated queries, unnecessarily frequent refreshes and inefficient game animations. A well-designed application avoids loading large assets before they are needed and keeps background processes to a minimum. Database indexing and caching can reduce processing for common requests. These measures can improve response times and lower compute demand per transaction when applied to real workload patterns.
Capacity management can match server counts and power states to demand. Autoscaling, rightsizing, scheduled non-production environments and retirements for unused instances can reduce idle consumption. A system serving payments or account security may require continuous availability; development and test environments often have more flexibility. Operational risk determines which workloads can be scheduled or powered down.
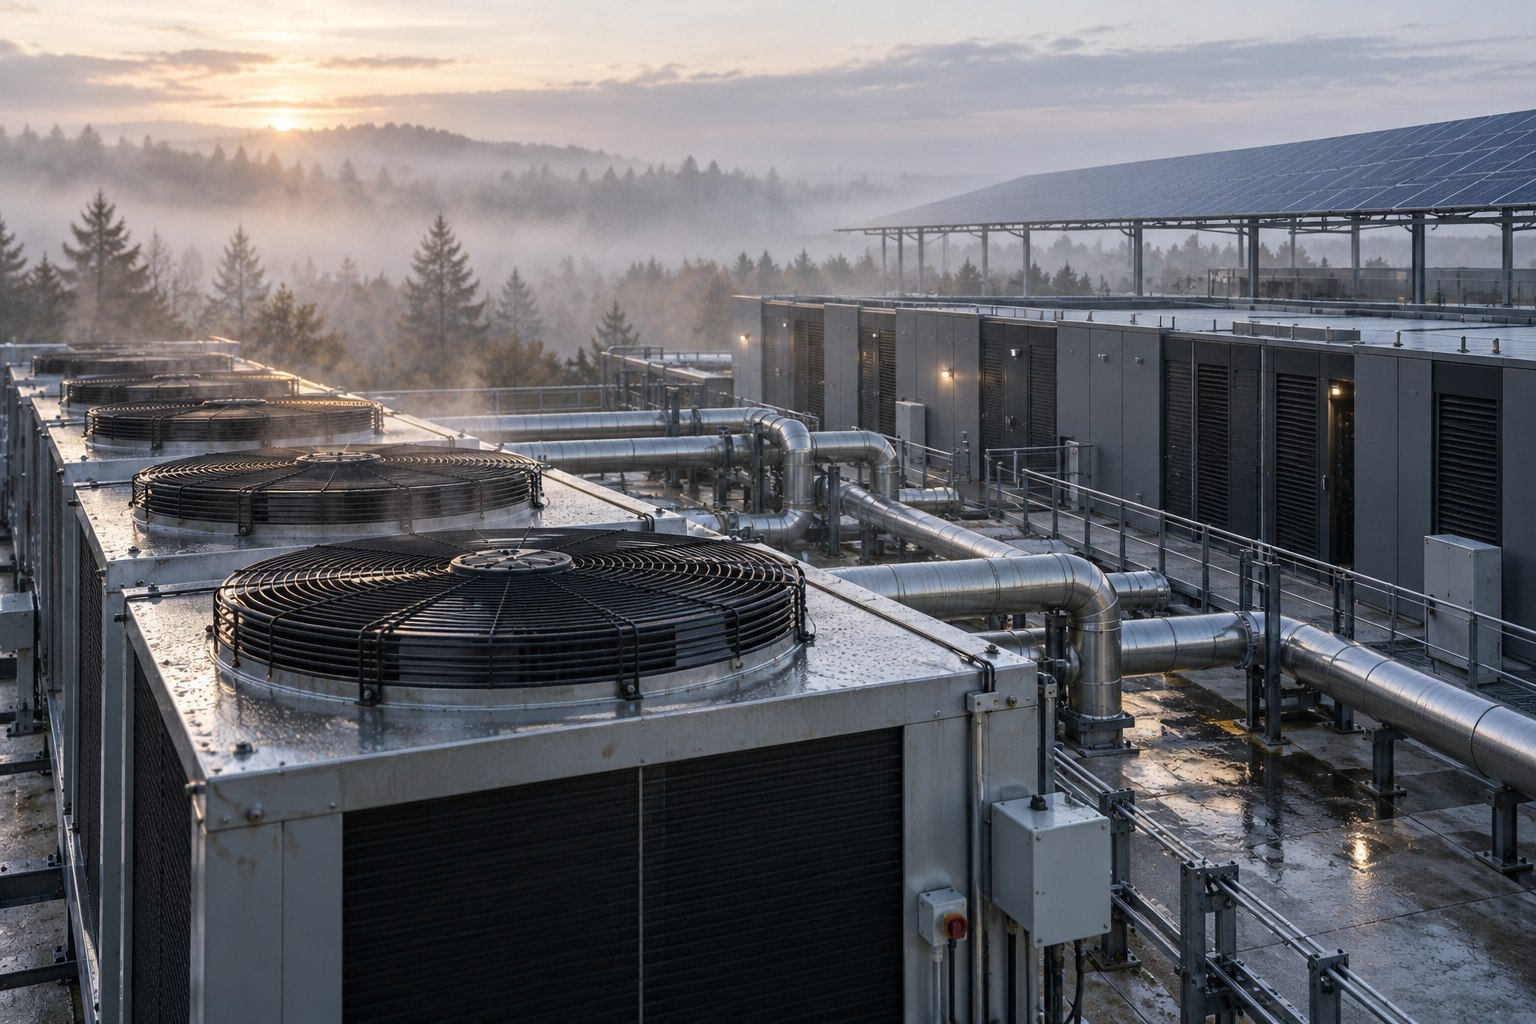
Cooling efficiency depends on server placement, airflow, temperature setpoints, hot-aisle containment and maintenance. Liquid cooling may support high-density racks, while air-based systems can be suitable for different loads. There is no universal cooling design. Operators should compare energy, water, reliability and location-specific constraints over the full operating year.
Service regions matter for New Zealand estimates
New Zealand customers may use infrastructure in several offshore regions while the operator reports only group-wide totals. A market estimate needs the regions and reporting period that served those sessions, plus a clear allocation method; a customer's location does not determine the grid mix of a remote server.
Separate locally operated offices and infrastructure from international hosting. Capacity, resilience or contract changes can move workloads during the year, so record migrations and note when geographic supplier data are unavailable. A group total alone cannot support a country-specific claim.
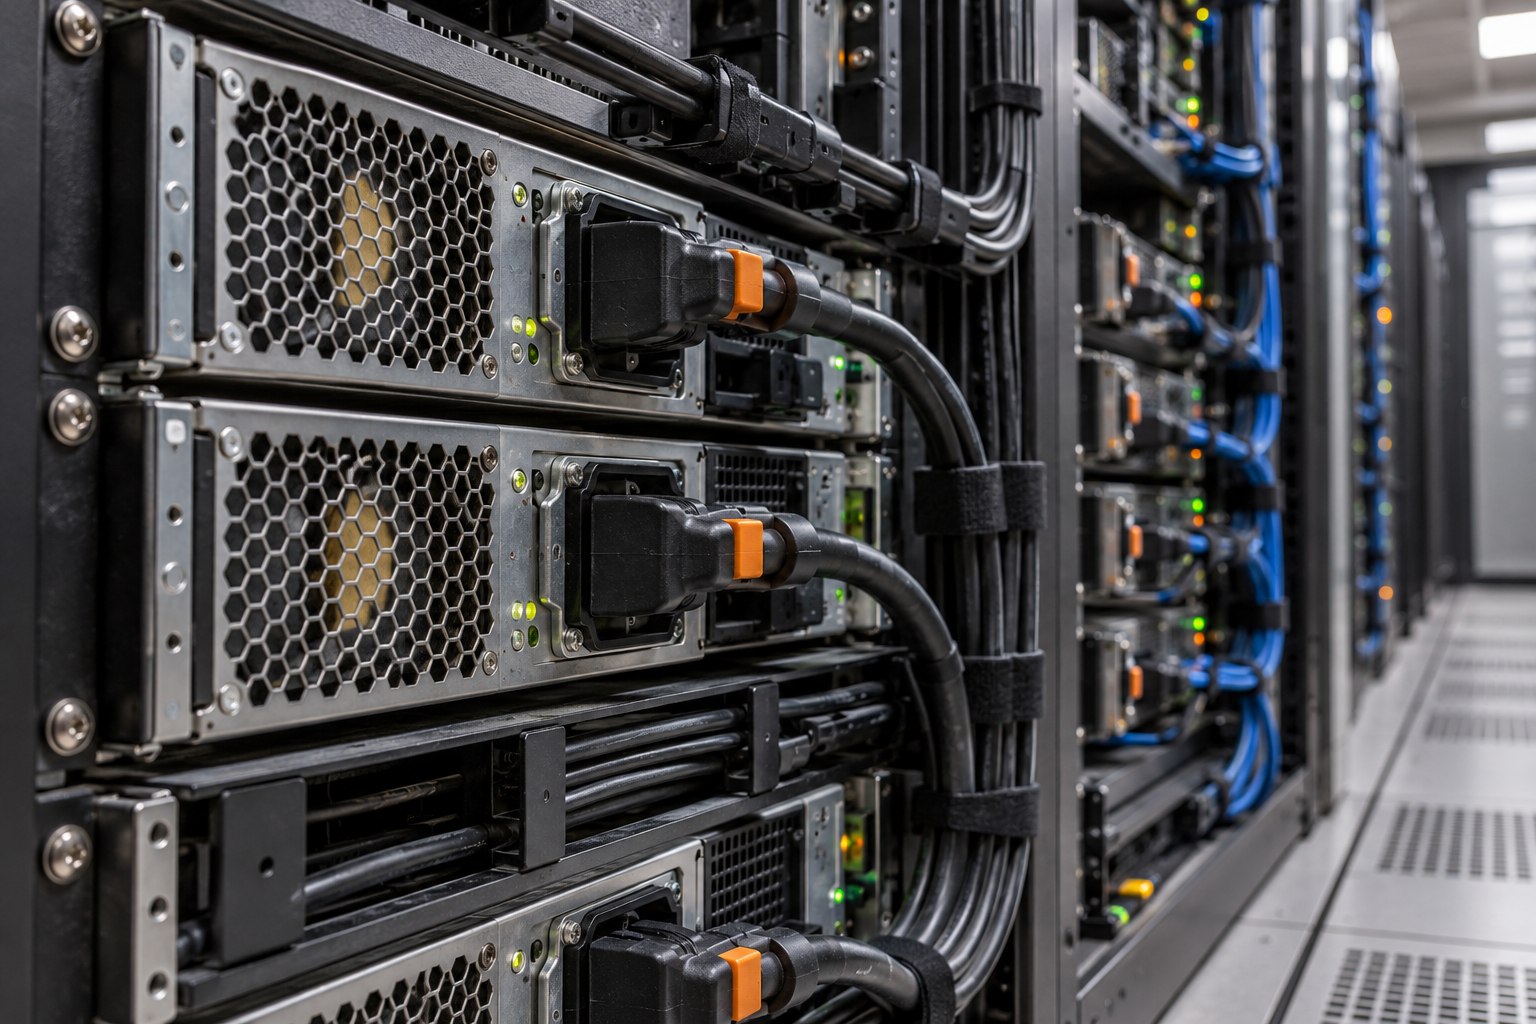
Evidence needed for a platform estimate
- Facility locations, reporting year and the share of workloads at each site.
- Electricity for IT equipment and the full facility, with PUE and cooling context.
- Compute, storage and network data tied to defined online services.
- Customer-device assumptions separated from measured platform electricity.
- Allocation rules for shared services, idle capacity and third-party infrastructure.
Where providers do not supply energy data, operators can estimate using server hours, data transferred, service-region information and documented equipment assumptions. The uncertainty should appear beside the result. A precise figure with an undisclosed allocation is less useful than a range with a transparent method.
Comparisons also need equivalent quality and safeguards. A low-resolution stream, reduced redundancy or shorter data retention may use fewer resources while delivering a different product or failing regulatory needs. A fair comparison holds reliability, security, accessibility and service quality within defined limits.
What the available numbers can support
Public cloud sustainability dashboards often show facility-level energy and water metrics for fleets or regions, not the exact footprint of an individual gaming customer. A platform can use those metrics as supplier evidence when the region, ownership boundary and year match its workload. If a provider publishes only a corporate renewable target, that statement does not reveal the electricity attributable to a casino service.
Operators can improve accountability through procurement terms. Cloud contracts may request service-region reporting, data-centre energy efficiency, renewable electricity accounting, water use, cooling type and assurance methods. Those requests are more actionable when tied to the platform’s material workloads and reviewed during contract renewal.
Energy per registered account can mislead when many accounts are dormant. Active accounts, session-hours, payments and game rounds measure different services; the denominator beside a platform total determines what its rate describes.