Cloud Gaming and Data Centres
Cloud gaming moves the graphics workload from a console or PC beside the player to a server elsewhere. The server renders each frame, encodes a video stream and sends it to the local device; player input travels back. The local screen still decodes and displays the stream, while the network carries data in both directions. The environmental comparison must include all three layers.
The central question is not whether the client device uses less power. It often does. The question is whether server, cooling, network and client electricity together use fewer resources for the same game quality and play time than a local rendering setup. The answer varies with server utilisation, device efficiency, stream resolution, data-centre location and home network.
Rendering is an always-changing server workload
Each player may occupy a virtual machine, graphics partition or dedicated console-class server during a session. Hardware can be shared across users when workloads and service requirements allow. Strong utilisation improves energy per player-hour, while underused servers still draw power and require cooling. Peak demand can force additional capacity even when the average player count is low.
High frame rates, ray tracing, detailed environments and high resolutions ask the server’s graphics processor to do more work. Codec choice and encoding settings shape how much processing is needed to deliver the video. A lower-resolution stream can cut data volume and compute, but it may reduce visual quality on a large screen. The service has to define a quality target before energy per hour can be compared.
Session length and concurrency create different operating patterns. A provider may have uneven demand across regions and time zones, with servers idling between peaks. Scheduling maintenance during quieter periods, consolidating suitable workloads and scaling capacity can lower idle energy. Reliability requirements still need reserve capacity, and aggressive shutdown can increase startup time or degrade service.
Cooling and power infrastructure add facility overhead
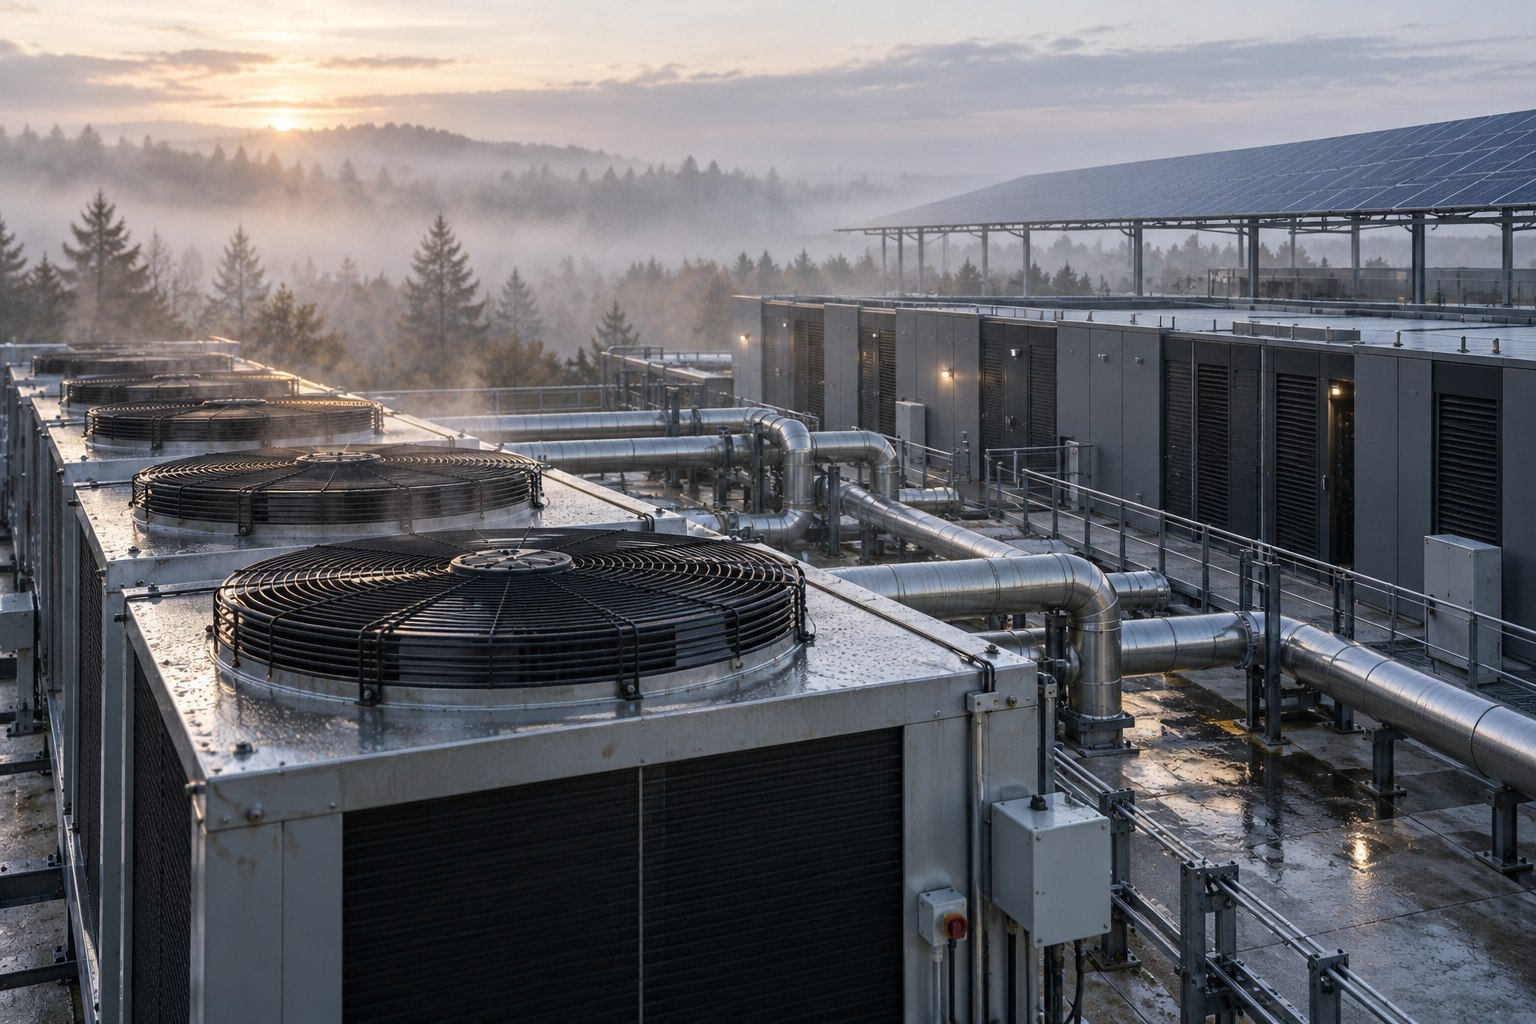
Data centres use power for servers, storage and networking, then add overhead for cooling, electrical conversion, lighting and security. PUE compares total facility electricity with IT equipment electricity. It helps identify facility overhead, but does not reveal whether the server workload is efficient or whether overall demand is increasing.
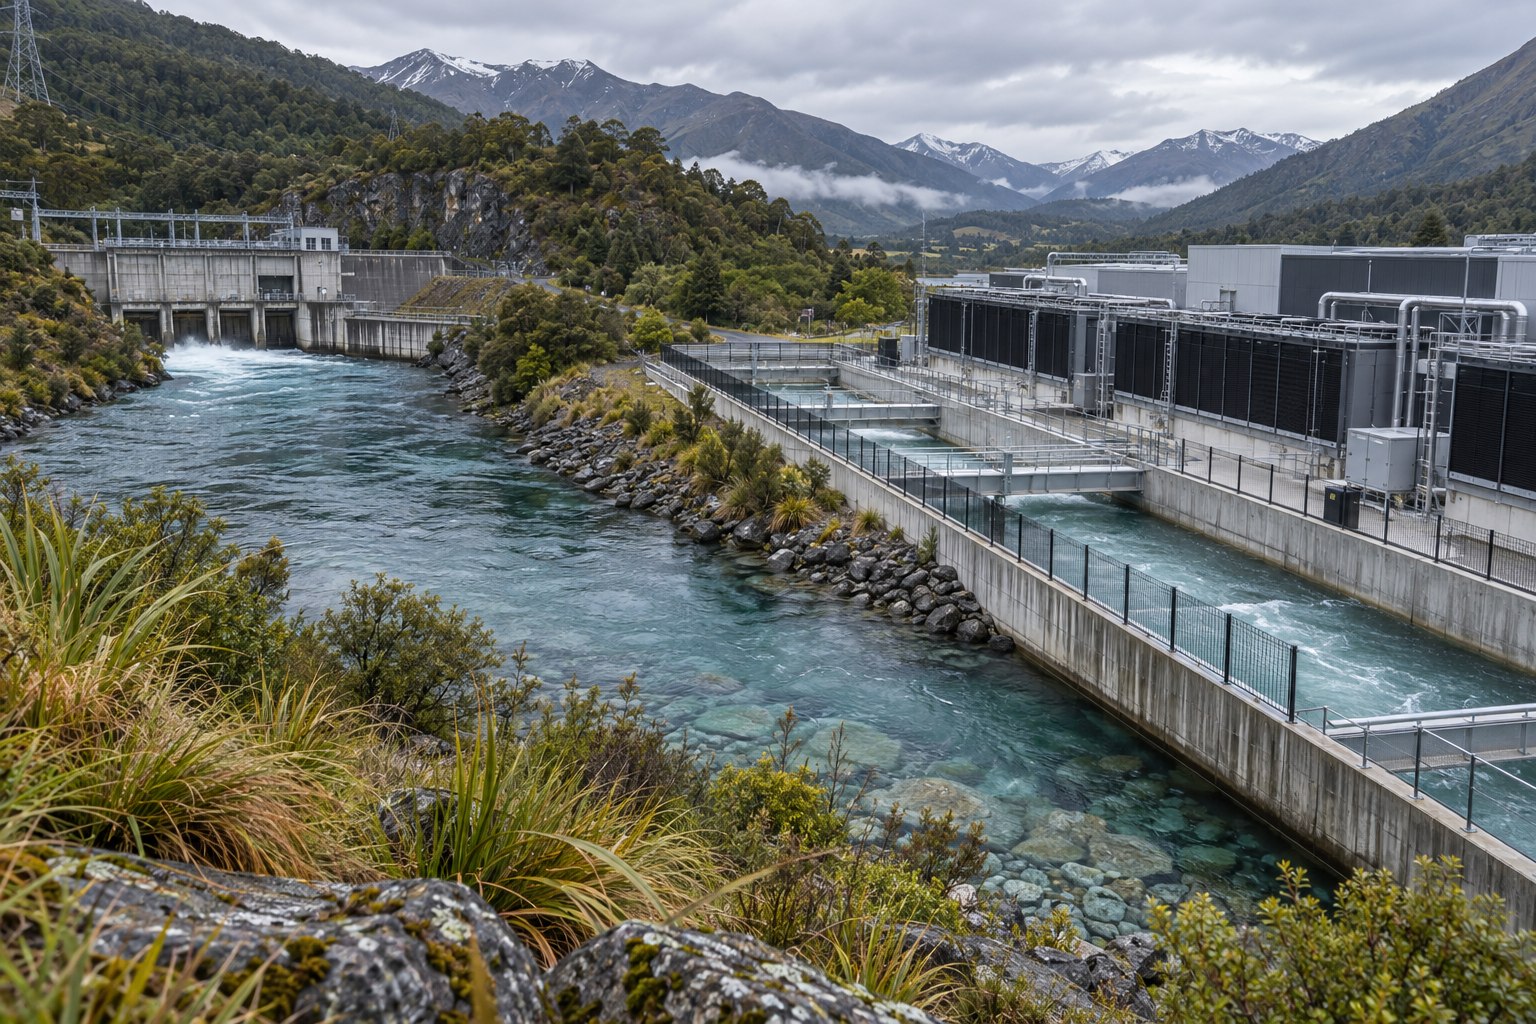
Cooling design depends on climate, rack density, water availability and operating cost. Air management, hot-aisle containment, efficient fans and higher permissible equipment temperatures can reduce cooling load. Liquid cooling can serve dense accelerator racks, but pumps and heat rejection remain part of the facility system. A low PUE alone cannot describe a site’s water or grid impact.
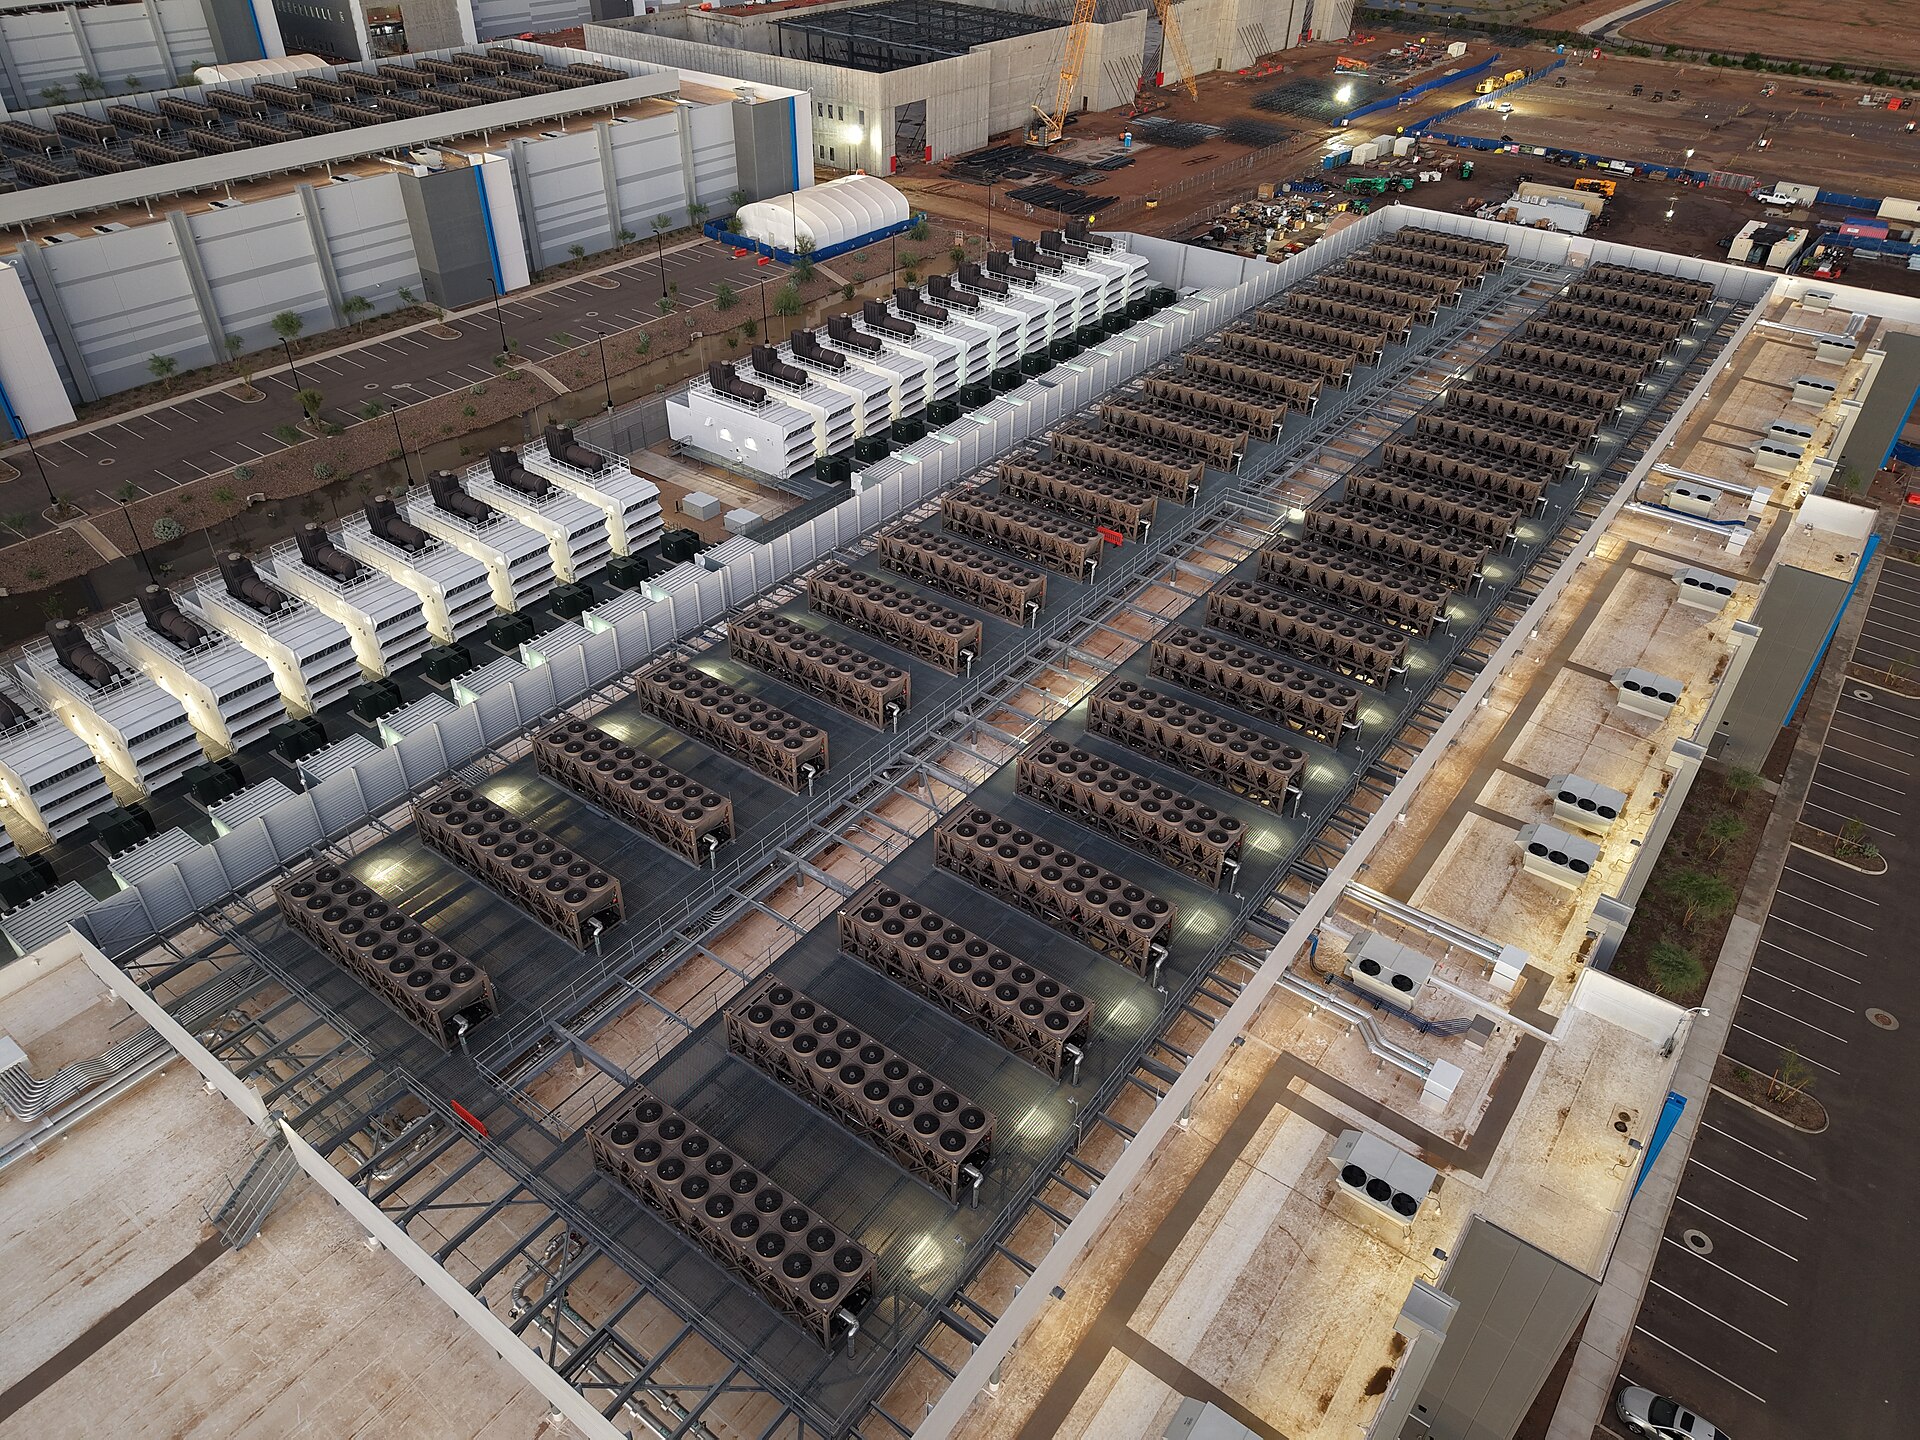
WUE expresses water use against IT energy, commonly in litres per kilowatt-hour. The metric should be read with a data-centre location and reporting year. Water consumed for cooling differs from water withdrawn and returned; electricity generation also has an indirect water footprint. A fleet average can hide regional variation in water stress.
| Layer | Energy driver | Decision that changes it |
|---|---|---|
| Game server | Graphics workload, frame rate and utilisation | Workload scheduling and server rightsizing |
| Encoding | Stream quality, codec and number of renditions | Match output to device and connection |
| Data-centre facility | Cooling, conversion losses and idle capacity | Airflow, plant controls and equipment efficiency |
| Network delivery | Data volume, distance and routing | Regional delivery, cache design and bitrate |
| Player device | Screen, decoding, wireless link and hours | Device choice, display settings and session duration |
Network distance and stream quality affect the result
A live game stream can transfer much more data than the small gameplay messages used in conventional online multiplayer. Network electricity depends on access technology, equipment efficiency, traffic volume, route and time. A home fibre router may be shared by work, video and other household activity, making a per-game allocation uncertain.
Edge servers can reduce latency by placing delivery capacity closer to players. They may reduce some long-distance traffic and improve responsiveness, while creating more locations with equipment that runs continuously. The trade-off depends on how much computation is moved to the edge, how well the servers are used and how the network would route the stream without them.
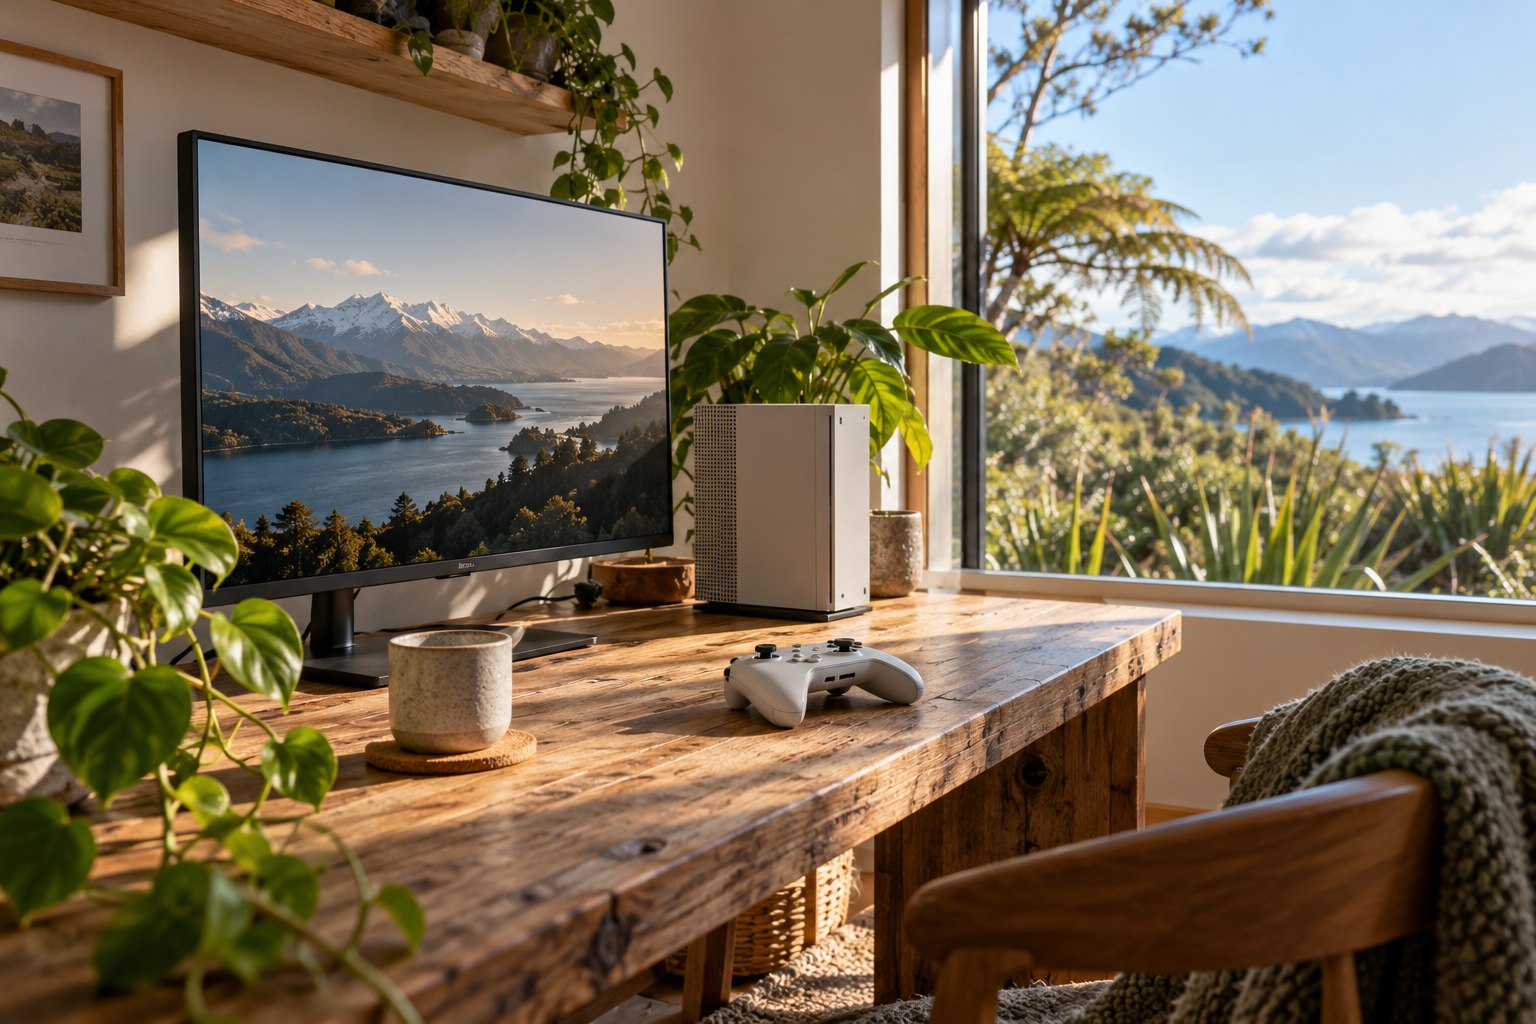
Mobile cloud gaming adds battery and radio use. A poor signal or high screen brightness can increase handset demand. A handheld device with a low-power display may be efficient at decoding video, but the server still renders the scene. Comparing cloud play on a phone with local play on a gaming PC is not meaningful unless the service quality and device function are matched.
Compare cloud and local play with a common service
A fair test uses the same title, scene, frame-rate target, resolution, session length and display. Measure local-device electricity at the wall and record whether the display and router are included. For cloud play, obtain provider data for server energy, facility overhead and network delivery where available; measure the client device separately.
The server-side allocation is usually the hardest part. A provider can estimate using GPU time, active player-hours, server capacity, data-centre energy and the fraction of that capacity assigned to the game. If the provider publishes only corporate totals, the user cannot derive a precise per-session result. A range based on stated assumptions is more credible than an exact decimal built from hidden averages.
The service bundle matters. Cloud gaming can reduce the need to buy a high-performance PC, but it does not automatically prevent a household from owning one. A device used for work, local games and other tasks should not be assigned entirely to cloud play. The same ownership and use assumptions should apply to both sides of the comparison.
New Zealand electricity is relevant only where it is used
New Zealand's grid factor applies to locally consumed electricity, not automatically to a cloud service watched here. Rendering may happen in Australia, Asia or another region. A credible estimate identifies the server location, accounting method and period, then applies the appropriate factor to each location.
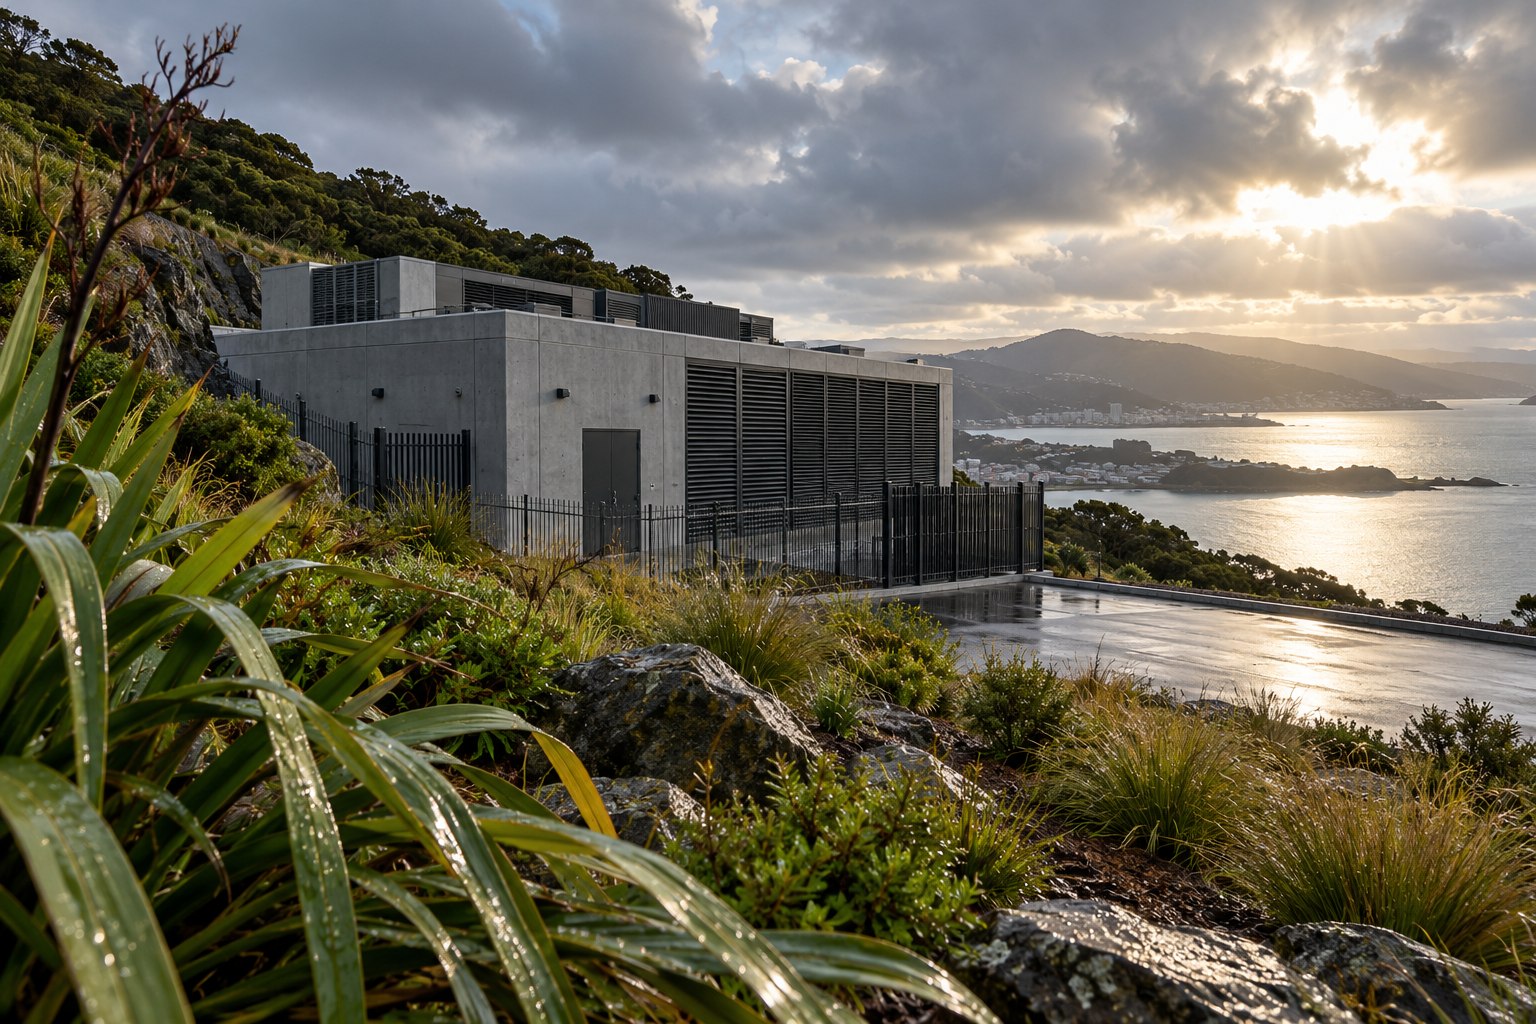
Nearby hosting can improve latency and shorten some network paths, but the facility's electricity mix, cooling and water source still matter. Procurement teams need region-level service data before they can compare those effects; neither a New Zealand factor applied to an offshore server nor an offshore average applied to local hosting is accurate.
Data-centre growth can raise total demand
Ask for both annual facility kWh and player-hours served in the same period. If player-hours rise 30% while kWh per player-hour falls 10%, total workload electricity still rises 17% before changes in other services are counted. A provider should state whether its facility total includes cooling and idle reserve capacity.
For the region that serves the game, request average and peak GPU utilisation, idle capacity, PUE, cooling-water use and a documented allocation method. These figures distinguish a well-used shared fleet from a fleet held ready for short peaks. A fleet-wide average without service-region or date cannot resolve the comparison.
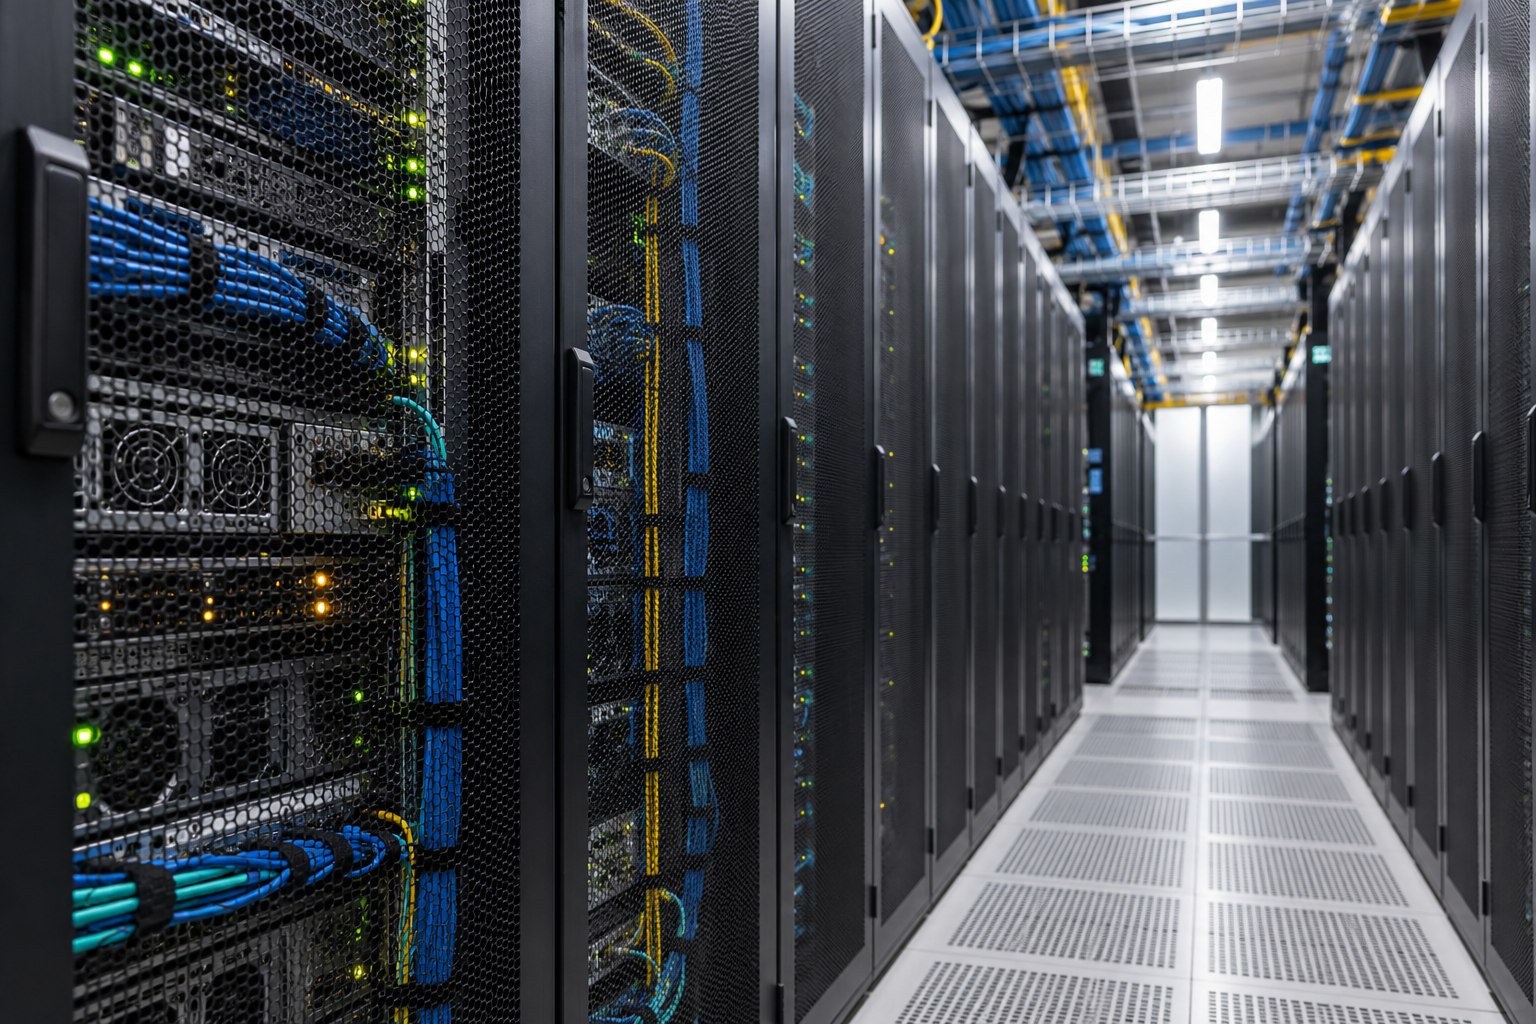
Data-centre expansion also requires grid connections, land, equipment, cooling and backup power. A new facility may support digital services and local employment, while affecting power planning and local water management. Environmental assessment needs to consider location and cumulative demand rather than treating each site as an isolated technical installation.
Ask providers for workload-level information
- Where cloud gaming compute and delivery run for each service region.
- Energy per IT workload and total facility energy for the same reporting period.
- PUE, WUE, cooling method and the source of water at the relevant site.
- Server utilisation, peak capacity and idle-load treatment in the allocation method.
- Stream quality, data volume and the method used to assign network energy.
A procurement record should name the serving region, reporting year, service volume and allocation rule for gaming workloads. Add a review trigger when the workload moves region or the provider changes its method; the same number should not be copied forward after the service architecture changes.
Data-centre efficiency guides treat IT equipment, room conditions, cooling, electrical systems and heat recovery as connected design areas. An improvement in one subsystem can reduce demand elsewhere: higher server efficiency may lower both IT electricity and the cooling load. The full facility should be measured after commissioning because design specifications do not guarantee actual operation.
Hybrid use can fit different gaming routines
A lower-power local device may suit lightweight games, cloud rendering can serve demanding titles, and an existing console or PC may remain the better choice where connectivity is weak. The material result depends on whether cloud access replaces a hardware purchase or adds another service; accounts, libraries and offline access also affect usefulness.
Compare cloud and local play at matched resolution, frame rate, game version and session length. Include the player's display and a stated share of network energy, not only the server or streaming stick, so the comparison covers the same experience.