Sustainable Gaming: Practical Examples
Gaming sustainability examples are most useful when they name a mechanism, a measurement boundary and a limitation. A console power mode, a game-performance setting and a casino-building dashboard affect different resources. They cannot be reduced to one ranking, yet they show how environmental work can become an operational practice rather than a general promise.
The cases below use company-published information. Company disclosures can identify design choices and operating measures, but their estimates depend on stated assumptions and are not automatically comparable across brands. The practical lesson is the measurement structure: what changed, what activity was counted and what the data still leave outside the boundary.
Xbox combines standby controls with flexible timing
Microsoft describes several Xbox interventions: Shutdown energy-saving mode, active-hours controls, carbon-aware updates and developer work on game code. The shutdown option reduces power while the console is off compared with Sleep, while active hours let users limit periods when the system remains ready. Carbon-aware updates can schedule downloads when available grid signals indicate lower-carbon electricity.
Microsoft reported that Xbox interventions prevented more than 1.2 million metric tonnes of CO₂e compared with a scenario without those interventions over FY20 - FY23. Its account combines product-use changes and is based on an estimated counterfactual. It should not be read as a measured saving for every console or as a full life-cycle reduction across hardware manufacturing and end-of-life. Microsoft’s FY20–FY23 counterfactual account.
The example works because the interventions target distinct loads. Shutdown mode addresses standby electricity; active hours change availability; carbon-aware scheduling changes timing; code optimisation can change game energy per unit of play. Evaluation should measure each mechanism separately and track feature adoption, kWh and total installed-base use.
PlayStation exposes a performance and power trade-off
Sony Interactive Entertainment says its Power Saver feature for PS5 and PS5 Pro can reduce console power consumption by up to 50% for supported games when users enable the option. The setting scales back performance in compatible titles. The maximum reduction belongs to that feature’s stated scope, not to every game or default console session. Sony’s 2026 feature update.
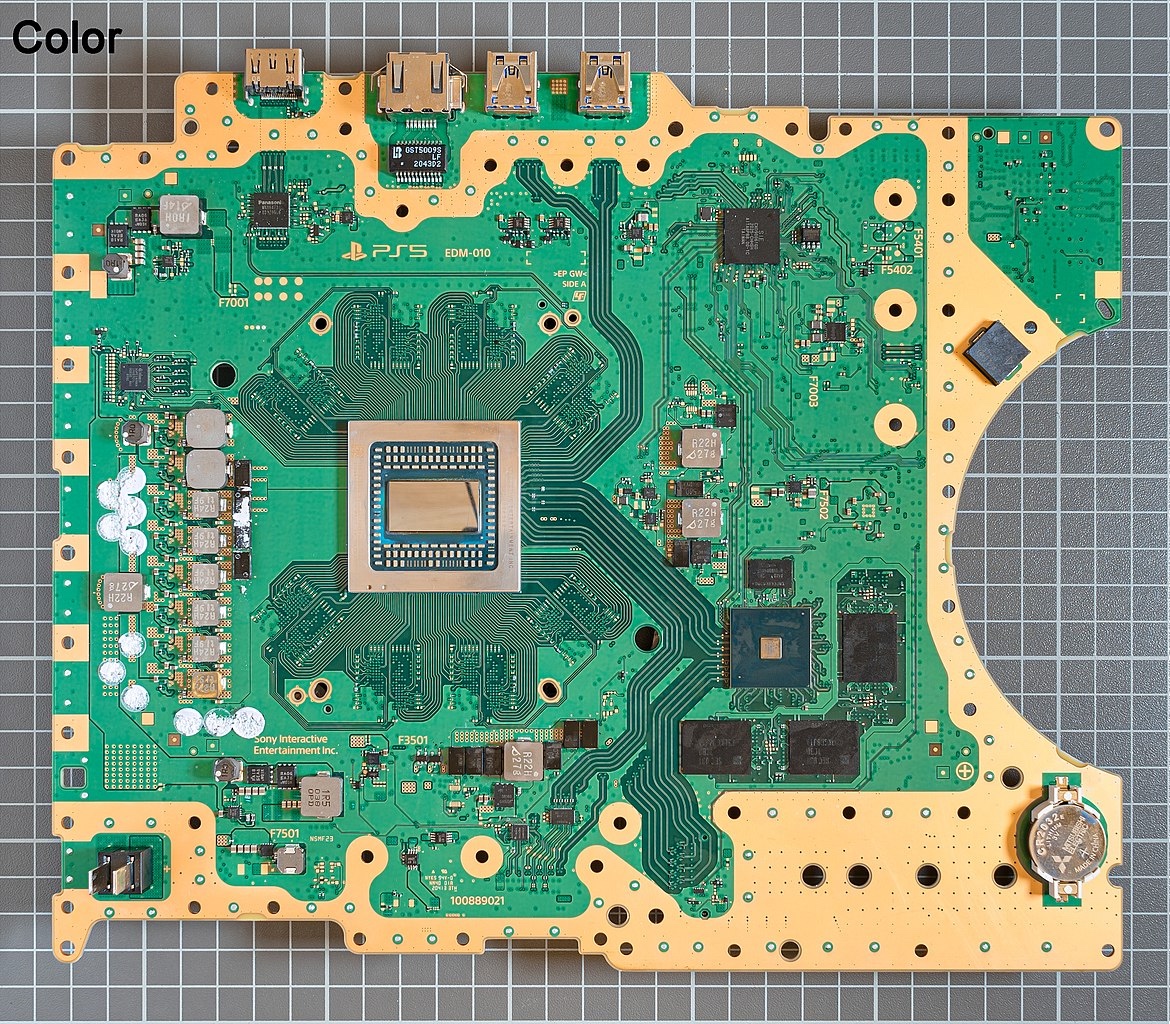
The company’s 2026 update places player use alongside manufacturing, packaging, distribution, retail, end-of-life, content delivery and data centres in its emissions boundary. It estimates that SIE’s total organisational emissions were about 16% lower in FY25 than FY24. Sony notes that estimates can vary with electricity carbon intensity and console sales cycles, which affects year-to-year comparisons.
The case highlights the need to report quality guardrails. A power reduction should be assessed with frame rate, resolution, visual performance and user adoption. If the setting saves energy but changes the experience, the report should describe the change. A maximum technical result and an average fleet result answer different questions.
CIRSA reports energy and water by operating scale
CIRSA’s 2025 sustainability report presents casino-group information that separates total energy, electricity, fuel, renewable energy and water. It includes intensity figures such as energy per gaming hall and water per square metre. That structure makes it possible to examine a change in total demand alongside venue efficiency. CIRSA 2025 sustainability report.
The report’s category-level detail is more useful than a statement that casinos are “sustainable”. Electricity and fuel can move in opposite directions; renewable supply can rise while total energy changes little; water per gaming hall can shift with property mix. The table should be read with the group’s venue coverage, reporting year and methodology.
CIRSA’s figures are a company disclosure from a multi-country casino group. They are not a direct benchmark for one New Zealand casino or resort. Local climate, hotel operations, floor area, opening hours, electricity sources and water conditions change the result. The reporting format can still guide a venue that wants comparable totals and intensity measures.
| Case | Operating lever | Boundary or limitation | Useful next metric |
|---|---|---|---|
| Xbox | Shutdown, active-hours settings, scheduled updates and game-code work | Reported avoided emissions rely on a counterfactual and feature adoption. | kWh per device-year, settings adoption and installed-base total |
| PlayStation | User-enabled performance scaling in supported games | Maximum reduction applies to compatible titles and selected mode. | Power, frame rate and quality under matched gameplay |
| CIRSA casinos | Energy and water reporting at group and venue intensity levels | Multi-country operations do not transfer directly to NZ venues. | Site totals with weather, occupancy and property coverage |
What makes a case comparable?
Each example needs a baseline, period and product or site boundary. A console power change, a venue energy-intensity figure and a company-wide emissions percentage describe different things. Counterfactual estimates should show the assumed device population, hours, settings and electricity factors rather than presenting a modelled saving as a meter reading.
Pair intensity with absolute totals. Energy per gaming hall or per session can fall while more venues or play hours raise overall demand. A case becomes transferable only when the reader can see both outcomes and the assumptions that drive them.
Interventions are tied to different decision-makers
Platform makers can design power states, update schedules and game-performance controls. Developers can optimise scenes and frame pacing. Casino operators can manage HVAC, lighting, water, food waste and machine replacement. Cloud providers can reduce idle server capacity and publish region-level water and electricity data.

Players can choose settings and keep hardware in use, but they cannot control supplier disclosure or product repair policy. Venue staff can adjust building schedules but may not control landlord plant. A useful case identifies the actor who can change the mechanism and the operational partner needed to make it work.
Training and interface design affect adoption. A setting buried in several menus may deliver less use than a clear default. A venue energy dashboard that staff cannot interpret may not change behaviour. The intervention should include instructions, ownership and a recurring review - not only a feature launch or equipment installation.
Translate the examples into a New Zealand test
Local tests should preserve the service they measure and use New Zealand electricity data only for local power. Offshore cloud jobs need provider-region data, while a venue's water account needs its actual source and catchment. One company example cannot forecast a whole sector without comparable equipment, hours and boundaries.
| Organisation | Local test | Guardrail |
|---|---|---|
| Studio | Workstation and build-server power management | Build time and output quality |
| Esports venue | Lighting and cooling across equivalent events | Attendance and weather |
| Retailer | Repair and collection routes for accepted devices | Secure handling and final destination |
A practical format for future cases
- State the asset, location, time period and baseline.
- Describe the technical or operating change in plain terms.
- Separate measured electricity and water from modelled emissions.
- Report total demand and an intensity measure with the same boundary.
- Name quality, reliability, comfort or safety guardrails.
A case can report a null result or a trade-off. A new control may lower energy per session but increase setup time; a water-saving cooling design may raise electricity use; refurbished equipment may require more maintenance. Reporting the trade-off helps another organisation decide whether the mechanism fits its setting.
A case record can fit on one page: intervention, baseline period, property or product boundary, denominator and absolute result. For an efficiency claim, the denominator matters: energy per user can fall while total use rises. The source note can identify whether each figure came from a meter, bill, product dashboard or unassured company account, so later comparisons use like evidence.